| Red | Green | Blue | |
| z | 17.64 | ||
| znorm | Inf | ||
| sky | -Inf | -Inf | -Inf |
| S/N | 23.3 | 35.5 | 36.5 |
| S/N(c) | 0.0 | 0.0 | 0.0 |
| SN(E/C) |

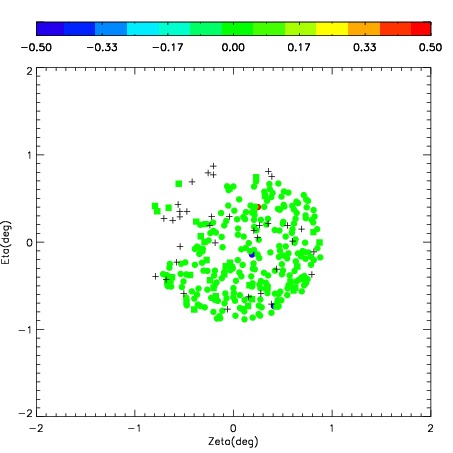
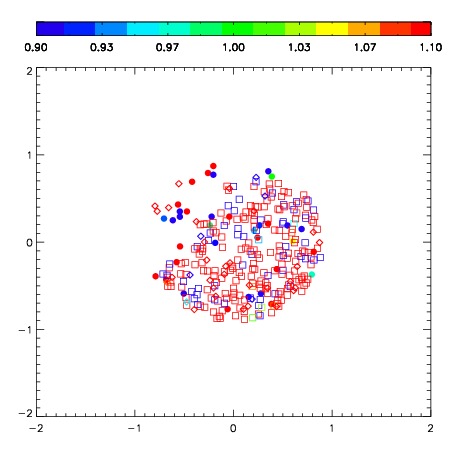

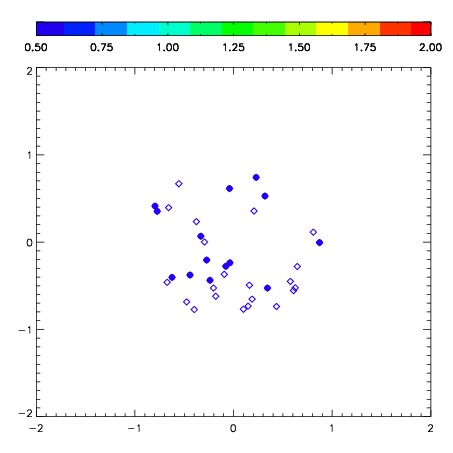
| Frame | Nreads | Zeropoints | Mag plots | Spatial mag deviation | Spatial sky 16325A emission deviations (filled: sky, open: star) | Spatial sky continuum emission | Spatial sky telluric CO2 absorption deviations (filled: H < 10) | |||||||||||||||||||||||
| 0 | 0 |
|
|
|
|
|
|
| IPAIR | NAME | SHIFT | NEWSHIFT | S/N | NAME | SHIFT | NEWSHIFT | S/N |
| 0 | 08990028 | 0.500615 | 0.00000 | 177.086 | 08990027 | 0.00000 | 0.500615 | 177.250 |
| 1 | 08990033 | 0.489710 | 0.0109050 | 211.269 | 08990034 | 0.0363100 | 0.464305 | 202.630 |
| 2 | 08990032 | 0.499069 | 0.00154600 | 191.029 | 08990030 | 0.0388173 | 0.461798 | 195.032 |
| 3 | 08990029 | 0.500203 | 0.000411987 | 186.654 | 08990031 | 0.0379508 | 0.462664 | 186.640 |