| Frame | Nreads | Zeropoints | Mag plots
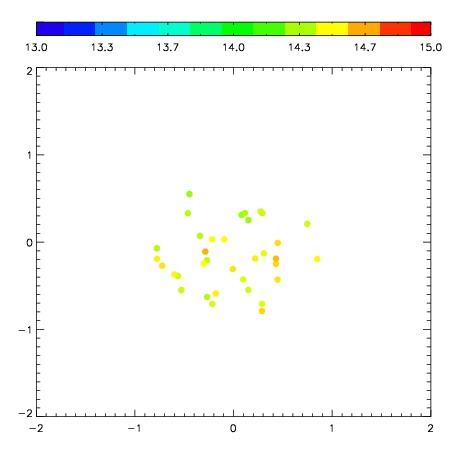
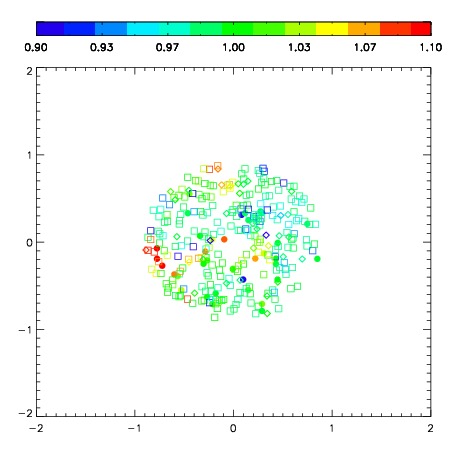
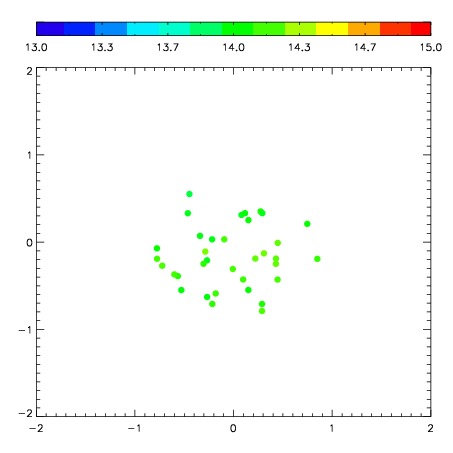
| Spatial mag deviation
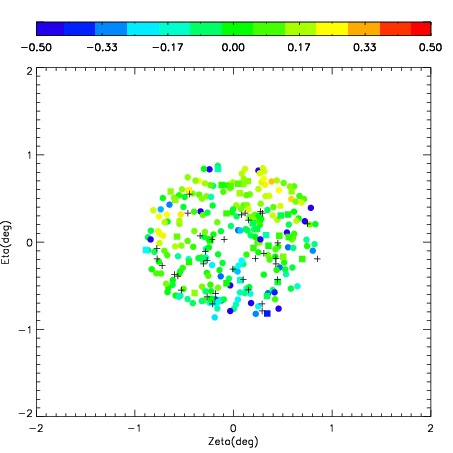
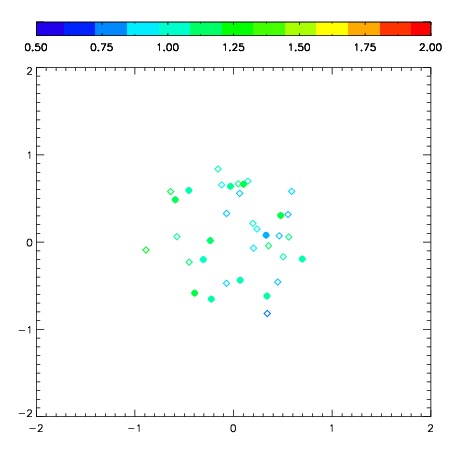
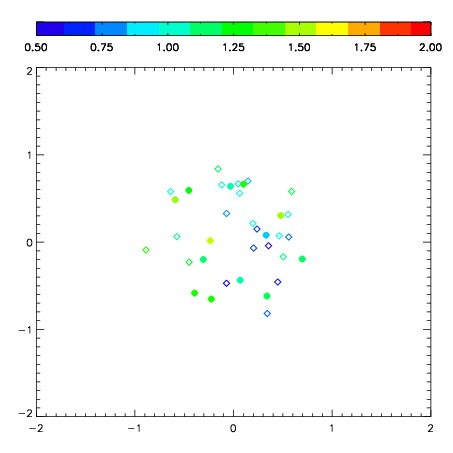
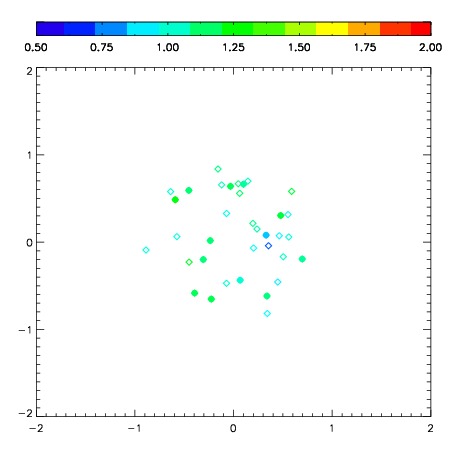
| Spatial sky 16325A emission deviations (filled: sky, open: star)
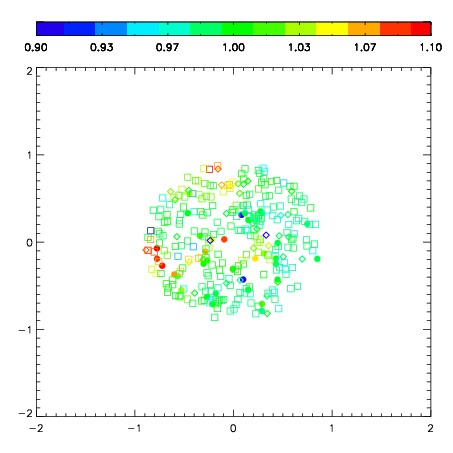
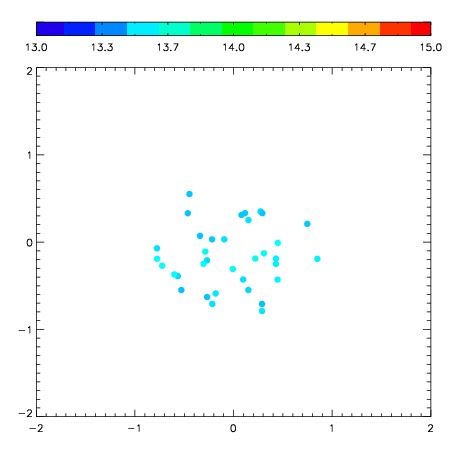
| Spatial sky continuum emission
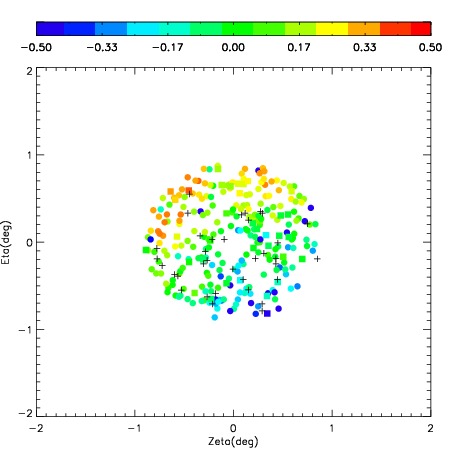
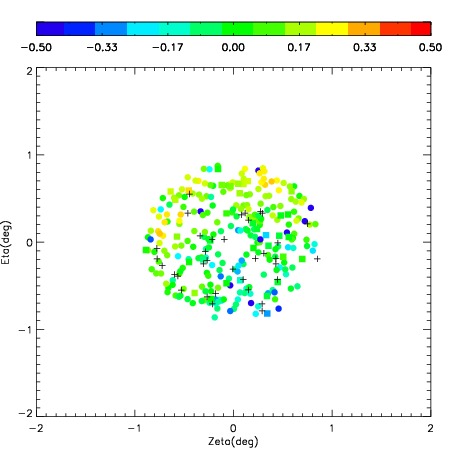
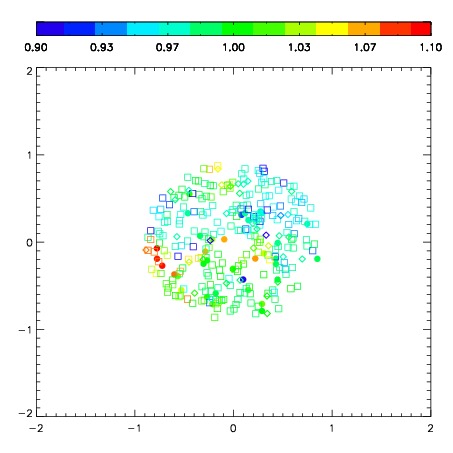
| Spatial sky telluric CO2 absorption deviations (filled: H < 10)
|
| 8280094
| 47
| | Red | Green | Blue
| | z | | 17.88
| | znorm | | 13.70
| | sky | 14.6 | 14.2 | 14.0
| | S/N | 8.3 | 13.7 | 13.8
| | S/N(c) | 7.1 | 11.9 | 12.4
| | SN(E/C) 1.00
|
| 
| 
| 
| 
| 
|
| 8280095
| 47
| | Red | Green | Blue
| | z | | 17.11
| | znorm | | 12.93
| | sky | 14.3 | 14.4 | 14.4
| | S/N | 3.9 | 7.9 | 7.7
| | S/N(c) | 3.4 | 6.7 | 7.0
| | SN(E/C) 1.03
|
| 
| 
| 
| 
| 
|
| 8280096
| 47
| | Red | Green | Blue
| | z | | 18.15
| | znorm | | 13.97
| | sky | 14.1 | 14.0 | 14.2
| | S/N | 9.6 | 16.0 | 16.3
| | S/N(c) | 8.2 | 14.0 | 14.7
| | SN(E/C) 1.00
|
| 
| 
| 
| 
| 
|
| 8280097
| 47
| | Red | Green | Blue
| | z | | 18.00
| | znorm | | 13.82
| | sky | 13.5 | 13.5 | 13.4
| | S/N | 8.2 | 13.7 | 14.0
| | S/N(c) | 7.0 | 12.0 | 12.7
| | SN(E/C) 1.01
|
| 
| 
| 
| 
| 
|