| Frame | Nreads | Zeropoints | Mag plots
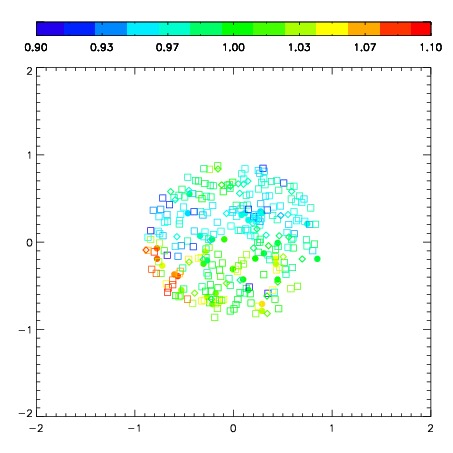
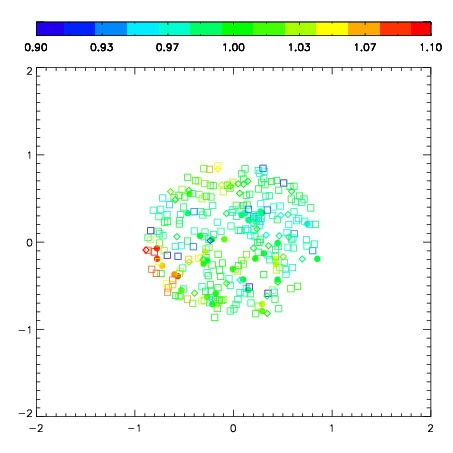
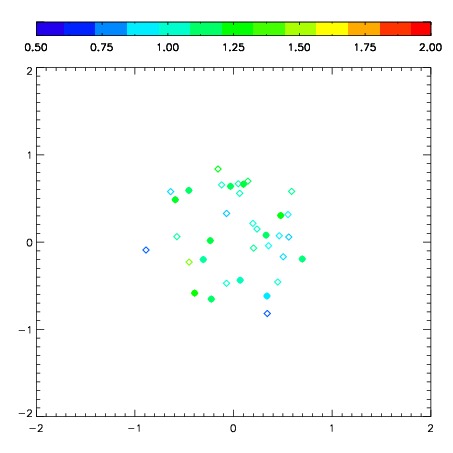
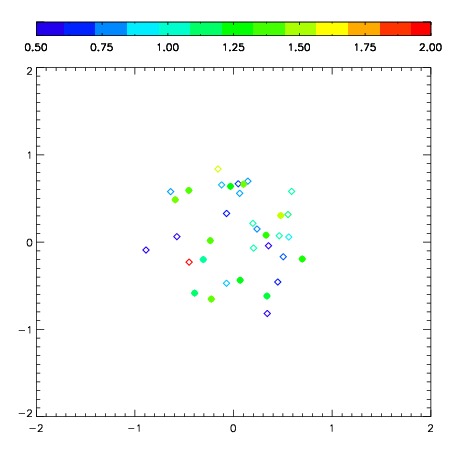
| Spatial mag deviation
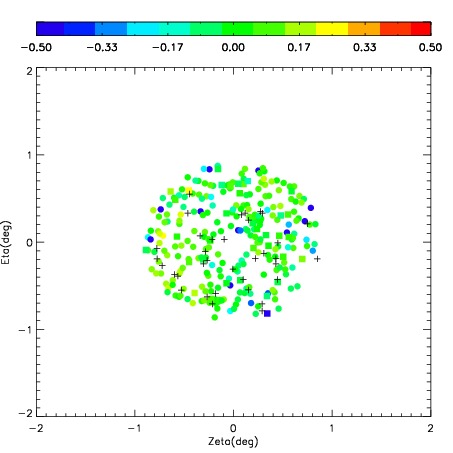
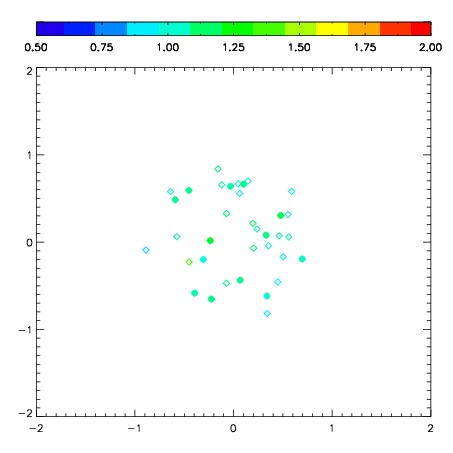
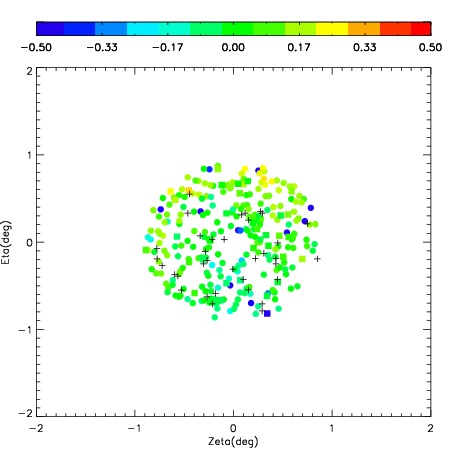
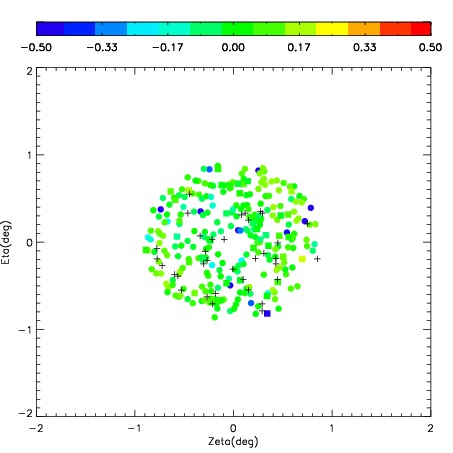
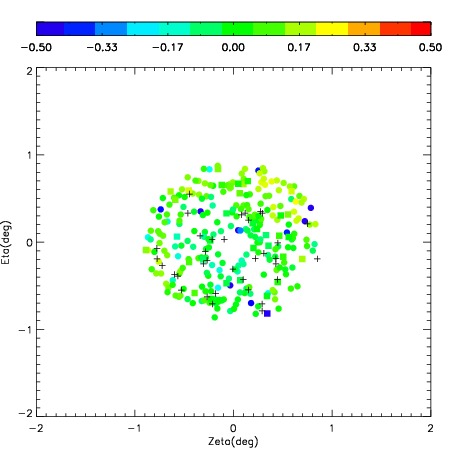
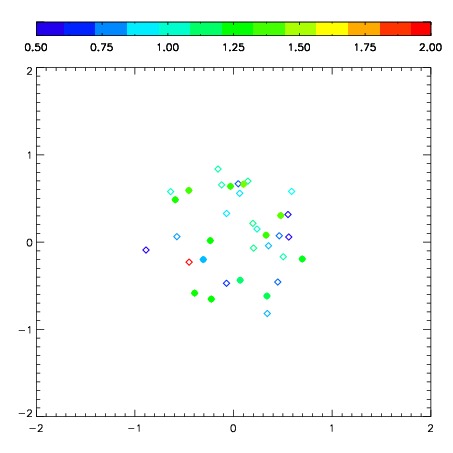
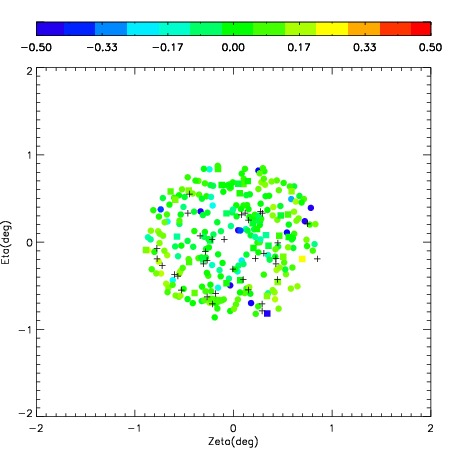
| Spatial sky 16325A emission deviations (filled: sky, open: star)
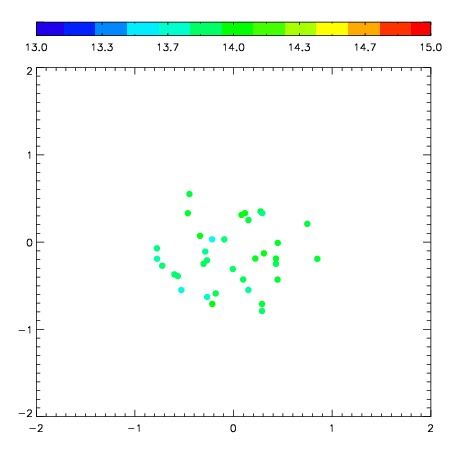
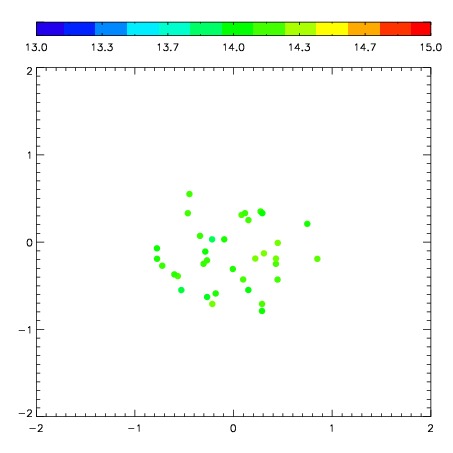
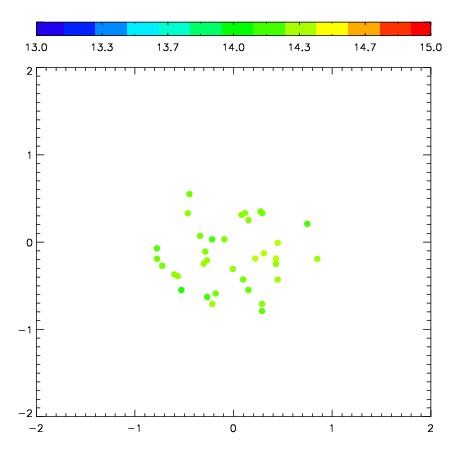
| Spatial sky continuum emission
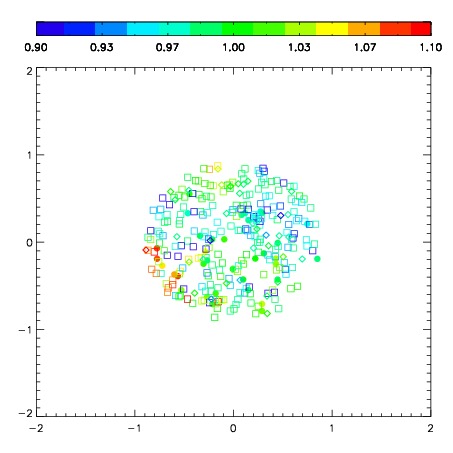
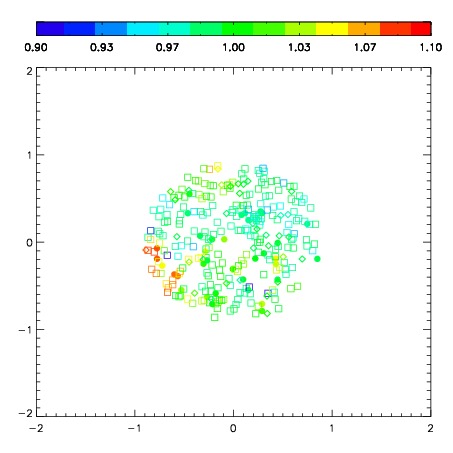
| Spatial sky telluric CO2 absorption deviations (filled: H < 10)
|
| 8430081
| 47
| | Red | Green | Blue
| | z | | 18.80
| | znorm | | 14.62
| | sky | 14.2 | 13.8 | 13.5
| | S/N | 14.3 | 21.7 | 22.1
| | S/N(c) | 12.6 | 19.9 | 21.4
| | SN(E/C) 0.94
|
| 
| 
| 
| 
| 
|
| 8430082
| 47
| | Red | Green | Blue
| | z | | 18.79
| | znorm | | 14.61
| | sky | 14.0 | 13.8 | 13.7
| | S/N | 14.1 | 21.6 | 22.2
| | S/N(c) | 12.4 | 19.6 | 21.2
| | SN(E/C) 0.91
|
| 
| 
| 
| 
| 
|
| 8430083
| 47
| | Red | Green | Blue
| | z | | 17.28
| | znorm | | 13.10
| | sky | 14.5 | 14.1 | 13.9
| | S/N | 4.7 | 8.9 | 7.9
| | S/N(c) | 4.0 | 8.0 | 8.8
| | SN(E/C) 1.11
|
| 
| 
| 
| 
| 
|
| 8430084
| 47
| | Red | Green | Blue
| | z | | 17.72
| | znorm | | 13.54
| | sky | 14.4 | 14.1 | 13.9
| | S/N | 6.2 | 10.8 | 9.9
| | S/N(c) | 5.2 | 9.6 | 10.2
| | SN(E/C) 0.99
|
| 
| 
| 
| 
| 
|
| 8430085
| 47
| | Red | Green | Blue
| | z | | 18.17
| | znorm | | 13.99
| | sky | 14.3 | 14.1 | 13.9
| | S/N | 8.9 | 15.1 | 14.9
| | S/N(c) | 7.6 | 13.3 | 14.3
| | SN(E/C) 0.94
|
| 
| 
| 
| 
| 
|
| 8430086
| 47
| | Red | Green | Blue
| | z | | 17.06
| | znorm | | 12.88
| | sky | 14.4 | 14.3 | 14.0
| | S/N | 3.6 | 7.1 | 6.0
| | S/N(c) | 3.1 | 6.3 | 6.8
| | SN(E/C) 1.10
|
| 
| 
| 
| 
| 
|
| 8430087
| 47
| | Red | Green | Blue
| | z | | 17.31
| | znorm | | 13.13
| | sky | 14.3 | 14.2 | 14.1
| | S/N | 4.5 | 8.9 | 8.1
| | S/N(c) | 3.8 | 7.7 | 8.3
| | SN(E/C) 1.01
|
| 
| 
| 
| 
| 
|
| 8430088
| 47
| | Red | Green | Blue
| | z | | 17.74
| | znorm | | 13.55
| | sky | 14.1 | 14.1 | 13.9
| | S/N | 6.3 | 11.4 | 11.0
| | S/N(c) | 5.4 | 10.0 | 10.8
| | SN(E/C) 0.99
|
| 
| 
| 
| 
| 
|