| Red | Green | Blue | |
| z | 17.64 | ||
| znorm | Inf | ||
| sky | -Inf | -Inf | -Inf |
| S/N | 14.9 | 25.1 | 27.2 |
| S/N(c) | 0.0 | 0.0 | 0.0 |
| SN(E/C) |
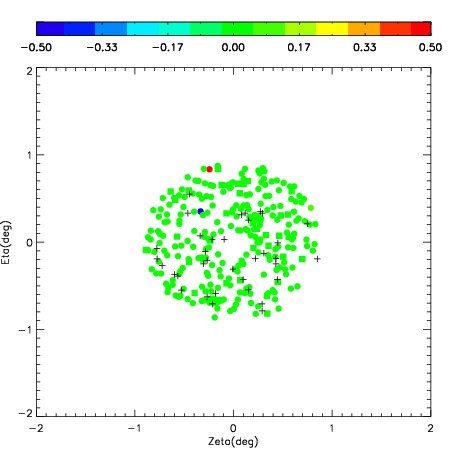
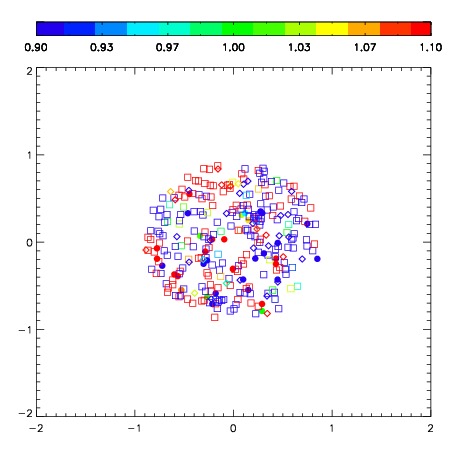
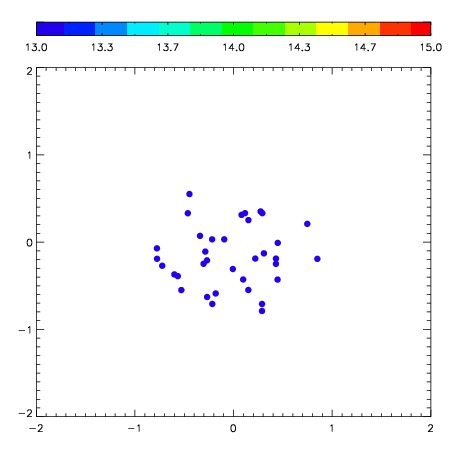
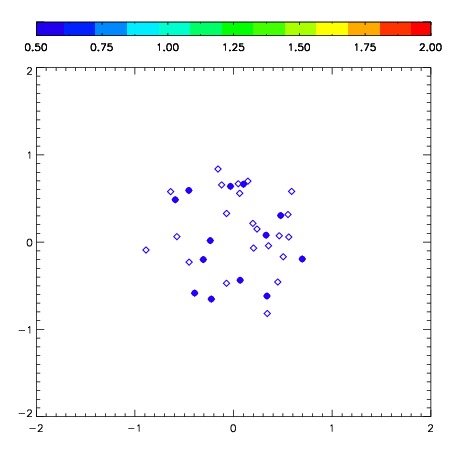
| Frame | Nreads | Zeropoints | Mag plots | Spatial mag deviation | Spatial sky 16325A emission deviations (filled: sky, open: star) | Spatial sky continuum emission | Spatial sky telluric CO2 absorption deviations (filled: H < 10) | |||||||||||||||||||||||
| 0 | 0 |
|
|
|
|
|
|
| IPAIR | NAME | SHIFT | NEWSHIFT | S/N | NAME | SHIFT | NEWSHIFT | S/N |
| 0 | 08430086 | 0.677634 | 0.00000 | 108.520 | 08430088 | 0.168188 | 0.509446 | 146.203 |
| 1 | 08430082 | 0.620457 | 0.0571770 | 240.613 | 08430081 | 0.00000 | 0.677634 | 244.472 |
| 2 | 08430087 | 0.665804 | 0.0118300 | 120.142 | 08430085 | 0.150084 | 0.527550 | 179.348 |
| 3 | 08430083 | 0.663652 | 0.0139820 | 117.017 | 08430084 | 0.159917 | 0.517717 | 147.833 |