| Red | Green | Blue | |
| z | 17.64 | ||
| znorm | Inf | ||
| sky | -NaN | -NaN | -Inf |
| S/N | 21.3 | 33.4 | 35.8 |
| S/N(c) | 0.0 | 0.0 | 0.0 |
| SN(E/C) |
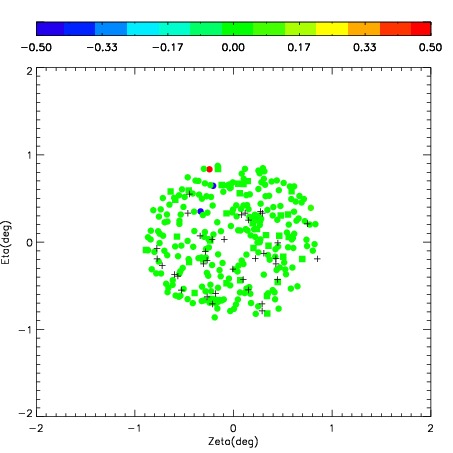
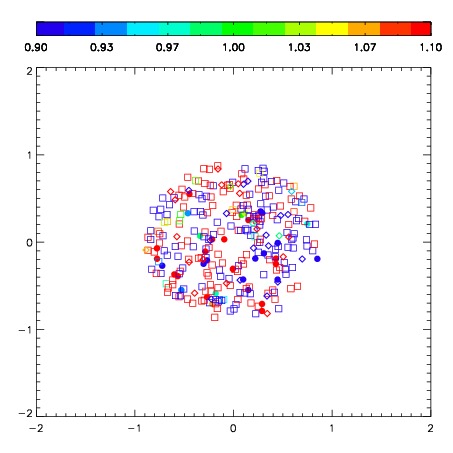


| Frame | Nreads | Zeropoints | Mag plots | Spatial mag deviation | Spatial sky 16325A emission deviations (filled: sky, open: star) | Spatial sky continuum emission | Spatial sky telluric CO2 absorption deviations (filled: H < 10) | |||||||||||||||||||||||
| 0 | 0 |
|
|
|
|
|
|
| IPAIR | NAME | SHIFT | NEWSHIFT | S/N | NAME | SHIFT | NEWSHIFT | S/N |
| 0 | 08440070 | 0.586552 | 0.00000 | 244.585 | 08440073 | 0.126543 | 0.460009 | 249.168 |
| 1 | 08440074 | 0.570404 | 0.0161480 | 251.197 | 08440069 | 0.00000 | 0.586552 | 250.831 |
| 2 | 08440071 | 0.580786 | 0.00576603 | 246.082 | 08440072 | 0.127482 | 0.459070 | 249.422 |