| Red | Green | Blue | |
| z | 17.64 | ||
| znorm | Inf | ||
| sky | -Inf | -Inf | -Inf |
| S/N | 30.4 | 45.1 | 48.0 |
| S/N(c) | 0.0 | 0.0 | 0.0 |
| SN(E/C) |


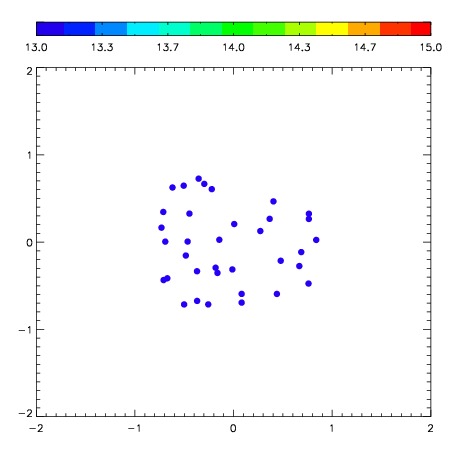
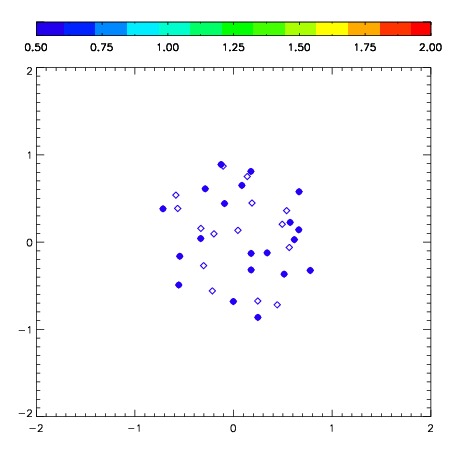
| Frame | Nreads | Zeropoints | Mag plots | Spatial mag deviation | Spatial sky 16325A emission deviations (filled: sky, open: star) | Spatial sky continuum emission | Spatial sky telluric CO2 absorption deviations (filled: H < 10) | |||||||||||||||||||||||
| 0 | 0 |
|
|
|
|
|
|
| IPAIR | NAME | SHIFT | NEWSHIFT | S/N | NAME | SHIFT | NEWSHIFT | S/N |
| 0 | 08410075 | 0.494567 | 0.00000 | 219.068 | 08410074 | 0.0340778 | 0.460489 | 211.510 |
| 1 | 08410071 | 0.483837 | 0.0107300 | 227.889 | 08410077 | 0.0378914 | 0.456676 | 221.162 |
| 2 | 08410076 | 0.480898 | 0.0136690 | 221.004 | 08410073 | 0.0329450 | 0.461622 | 220.172 |
| 3 | 08410072 | 0.490689 | 0.00387800 | 217.154 | 08410070 | 0.00000 | 0.494567 | 0.00000 |