| Red | Green | Blue | |
| z | 17.64 | ||
| znorm | Inf | ||
| sky | -NaN | -NaN | -Inf |
| S/N | 15.1 | 24.5 | 26.3 |
| S/N(c) | 0.0 | 0.0 | 0.0 |
| SN(E/C) |
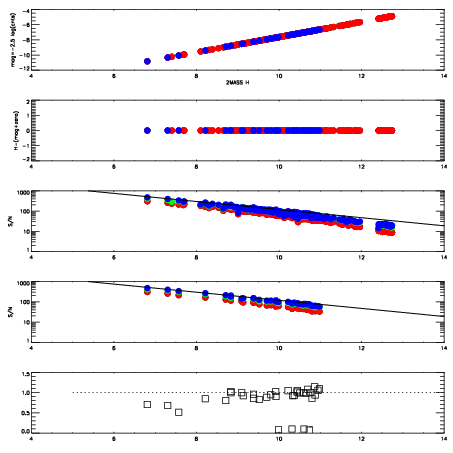
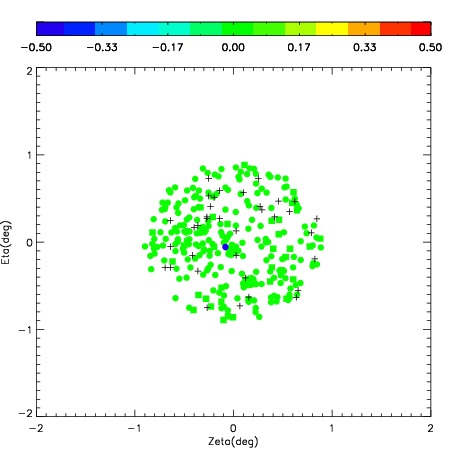
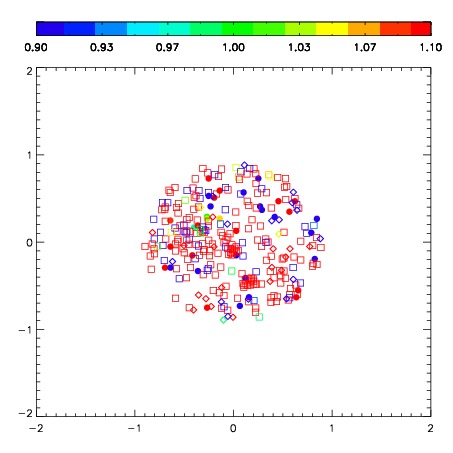
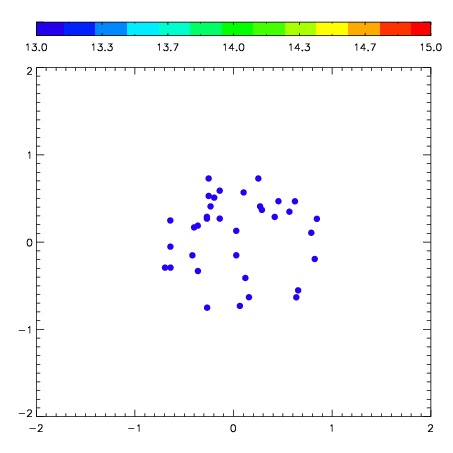
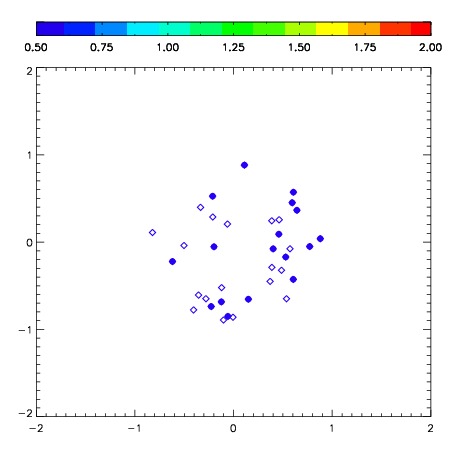
| Frame | Nreads | Zeropoints | Mag plots | Spatial mag deviation | Spatial sky 16325A emission deviations (filled: sky, open: star) | Spatial sky continuum emission | Spatial sky telluric CO2 absorption deviations (filled: H < 10) | |||||||||||||||||||||||
| 0 | 0 |
|
|
|
|
|
|
| IPAIR | NAME | SHIFT | NEWSHIFT | S/N | NAME | SHIFT | NEWSHIFT | S/N |
| 0 | 08830011 | 0.522681 | 0.00000 | 156.479 | 08830010 | 0.00000 | 0.522681 | 131.623 |
| 1 | 08830015 | 0.514741 | 0.00793999 | 201.121 | 08830017 | 0.0471944 | 0.475487 | 207.580 |
| 2 | 08830016 | 0.519138 | 0.00354302 | 180.930 | 08830014 | 0.0463943 | 0.476287 | 196.532 |
| 3 | 08830012 | 0.520830 | 0.00185102 | 173.881 | 08830013 | 0.0454900 | 0.477191 | 184.353 |