| Red | Green | Blue | |
| z | 17.64 | ||
| znorm | Inf | ||
| sky | -NaN | -NaN | -Inf |
| S/N | 26.6 | 45.4 | 49.2 |
| S/N(c) | 0.0 | 0.0 | 0.0 |
| SN(E/C) |

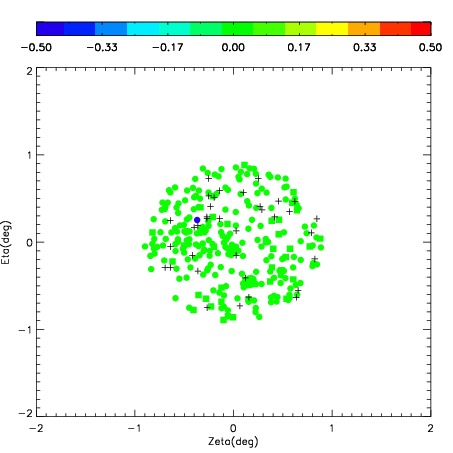
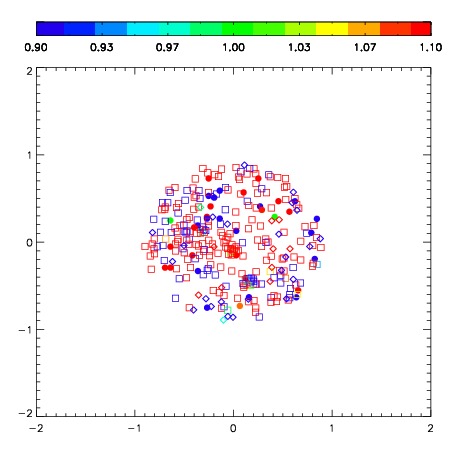

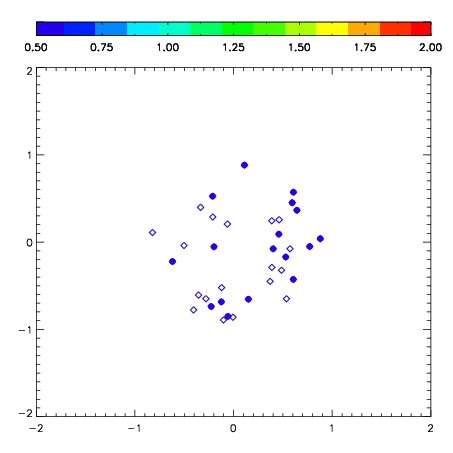
| Frame | Nreads | Zeropoints | Mag plots | Spatial mag deviation | Spatial sky 16325A emission deviations (filled: sky, open: star) | Spatial sky continuum emission | Spatial sky telluric CO2 absorption deviations (filled: H < 10) | |||||||||||||||||||||||
| 0 | 0 |
|
|
|
|
|
|
| IPAIR | NAME | SHIFT | NEWSHIFT | S/N | NAME | SHIFT | NEWSHIFT | S/N |
| 0 | 09070041 | 0.460389 | 0.00000 | 254.013 | 09070039 | 0.0207135 | 0.439675 | 256.581 |
| 1 | 09070042 | 0.454962 | 0.00542700 | 261.894 | 09070043 | 0.0256718 | 0.434717 | 259.937 |
| 2 | 09070037 | 0.453165 | 0.00722399 | 258.920 | 09070040 | 0.0204504 | 0.439939 | 258.470 |
| 3 | 09070038 | 0.452323 | 0.00806600 | 252.868 | 09070036 | 0.00000 | 0.460389 | 253.551 |