| Red | Green | Blue | |
| z | 17.64 | ||
| znorm | Inf | ||
| sky | -NaN | -Inf | -Inf |
| S/N | 39.6 | 57.8 | 62.2 |
| S/N(c) | 0.0 | 0.0 | 0.0 |
| SN(E/C) |
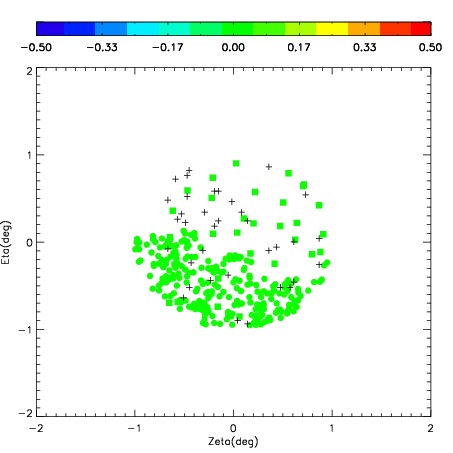


| Frame | Nreads | Zeropoints | Mag plots | Spatial mag deviation | Spatial sky 16325A emission deviations (filled: sky, open: star) | Spatial sky continuum emission | Spatial sky telluric CO2 absorption deviations (filled: H < 10) | |||||||||||||||||||||||
| 0 | 0 |
|
|
|
|
|
|
| IPAIR | NAME | SHIFT | NEWSHIFT | S/N | NAME | SHIFT | NEWSHIFT | S/N |
| 0 | 08420082 | 0.430634 | 0.00000 | 232.491 | 08420081 | 0.00000 | 0.430634 | 231.807 |
| 1 | 08420083 | 0.426942 | 0.00369200 | 235.771 | 08420084 | 0.0257145 | 0.404920 | 234.994 |
| 2 | 08420087 | 0.422346 | 0.00828800 | 235.174 | 08420085 | 0.0163415 | 0.414292 | 234.295 |
| 3 | 08420086 | 0.425321 | 0.00531298 | 233.688 | 08420089 | 0.0162262 | 0.414408 | 232.430 |
| 4 | 08420090 | 0.428487 | 0.00214699 | 232.259 | 08420088 | 0.0163994 | 0.414235 | 226.707 |