| Red | Green | Blue | |
| z | 17.64 | ||
| znorm | Inf | ||
| sky | -NaN | -NaN | -Inf |
| S/N | 22.3 | 33.4 | 35.4 |
| S/N(c) | 0.0 | 0.0 | 0.0 |
| SN(E/C) |
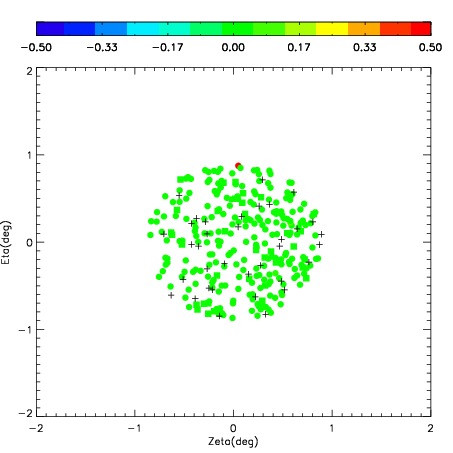

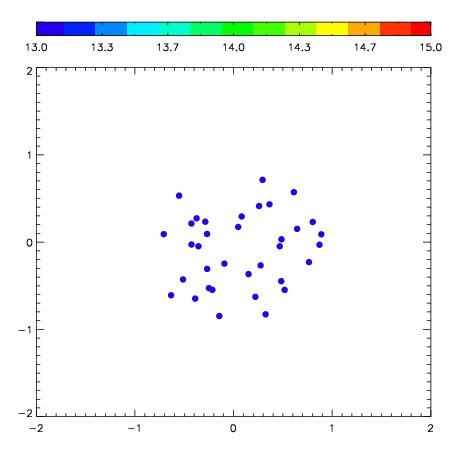

| Frame | Nreads | Zeropoints | Mag plots | Spatial mag deviation | Spatial sky 16325A emission deviations (filled: sky, open: star) | Spatial sky continuum emission | Spatial sky telluric CO2 absorption deviations (filled: H < 10) | |||||||||||||||||||||||
| 0 | 0 |
|
|
|
|
|
|
| IPAIR | NAME | SHIFT | NEWSHIFT | S/N | NAME | SHIFT | NEWSHIFT | S/N |
| 0 | 08460111 | 0.571029 | 0.00000 | 183.439 | 08460105 | 0.00000 | 0.571029 | 193.853 |
| 1 | 08460106 | 0.564611 | 0.00641799 | 216.571 | 08460112 | 0.100545 | 0.470484 | 222.850 |
| 2 | 08460110 | 0.564941 | 0.00608802 | 209.015 | 08460108 | 0.101611 | 0.469418 | 198.703 |
| 3 | 08460107 | 0.567749 | 0.00327998 | 190.789 | 08460109 | 0.103846 | 0.467183 | 194.280 |