| Red | Green | Blue | |
| z | 17.64 | ||
| znorm | Inf | ||
| sky | -Inf | -Inf | -Inf |
| S/N | 18.5 | 28.0 | 29.6 |
| S/N(c) | 0.0 | 0.0 | 0.0 |
| SN(E/C) |

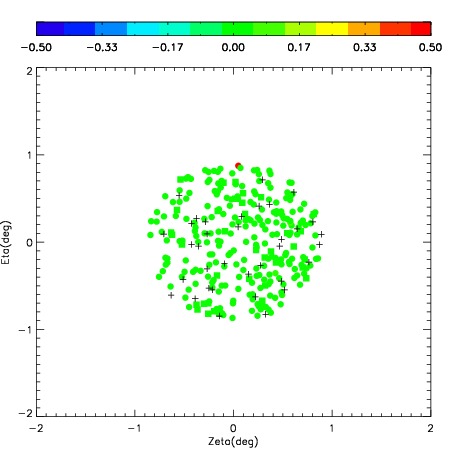
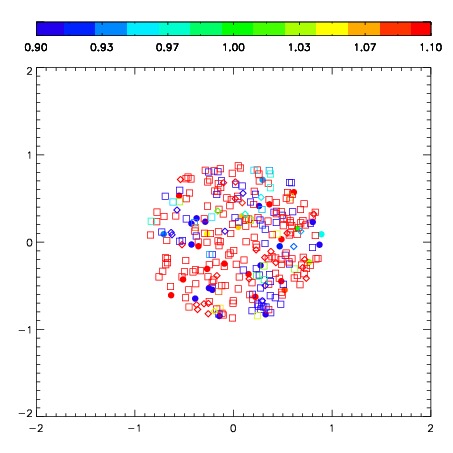
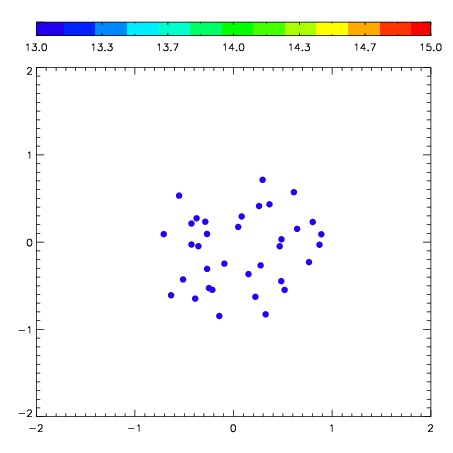
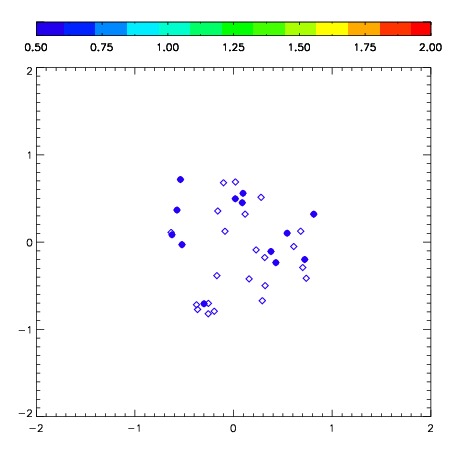
| Frame | Nreads | Zeropoints | Mag plots | Spatial mag deviation | Spatial sky 16325A emission deviations (filled: sky, open: star) | Spatial sky continuum emission | Spatial sky telluric CO2 absorption deviations (filled: H < 10) | |||||||||||||||||||||||
| 0 | 0 |
|
|
|
|
|
|
| IPAIR | NAME | SHIFT | NEWSHIFT | S/N | NAME | SHIFT | NEWSHIFT | S/N |
| 0 | 08470095 | 0.558465 | 0.00000 | 146.517 | 08470093 | 0.00000 | 0.558465 | 159.800 |
| 1 | 08470098 | 0.551358 | 0.00710702 | 204.704 | 08470100 | 0.143724 | 0.414741 | 208.085 |
| 2 | 08470099 | 0.554316 | 0.00414902 | 186.049 | 08470097 | 0.0966132 | 0.461852 | 183.139 |
| 3 | 08470094 | 0.556660 | 0.00180501 | 155.102 | 08470096 | 0.0969399 | 0.461525 | 165.432 |