| Red | Green | Blue | |
| z | 17.64 | ||
| znorm | Inf | ||
| sky | -Inf | -Inf | -Inf |
| S/N | 13.0 | 21.5 | 22.4 |
| S/N(c) | 0.0 | 0.0 | 0.0 |
| SN(E/C) |

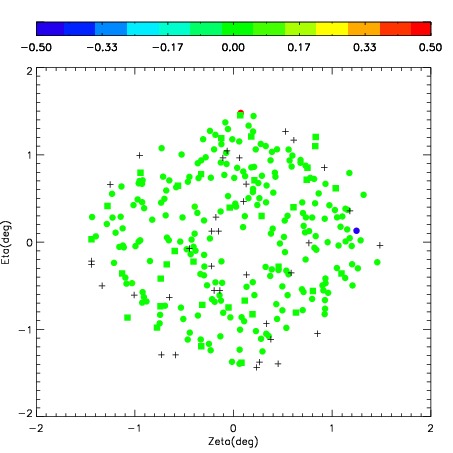

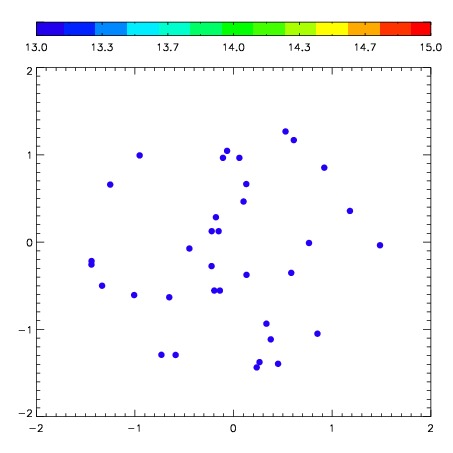
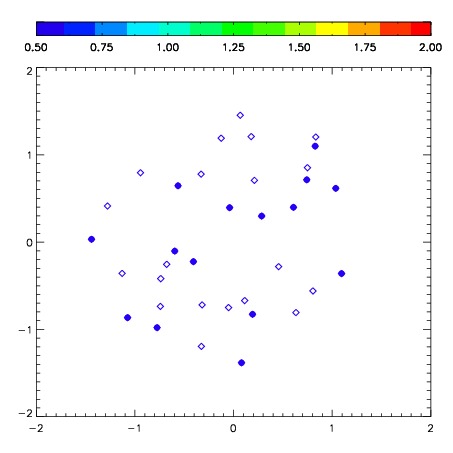
| Frame | Nreads | Zeropoints | Mag plots | Spatial mag deviation | Spatial sky 16325A emission deviations (filled: sky, open: star) | Spatial sky continuum emission | Spatial sky telluric CO2 absorption deviations (filled: H < 10) | |||||||||||||||||||||||
| 0 | 0 |
|
|
|
|
|
|
| IPAIR | NAME | SHIFT | NEWSHIFT | S/N | NAME | SHIFT | NEWSHIFT | S/N |
| 0 | 08790011 | 0.520912 | 0.00000 | 64.9472 | 08790010 | 0.00000 | 0.520912 | 41.7211 |
| 1 | 08790012 | 0.486330 | 0.0345820 | 159.474 | 08790014 | 0.0480811 | 0.472831 | 202.051 |
| 2 | 08790015 | 0.504383 | 0.0165290 | 127.935 | 08790017 | 0.0492045 | 0.471707 | 188.066 |
| 3 | 08790016 | 0.504365 | 0.0165470 | 103.549 | 08790013 | 0.0533630 | 0.467549 | 149.175 |