| Red | Green | Blue | |
| z | 17.64 | ||
| znorm | Inf | ||
| sky | -Inf | -NaN | -Inf |
| S/N | 19.3 | 32.5 | 35.1 |
| S/N(c) | 0.0 | 0.0 | 0.0 |
| SN(E/C) |

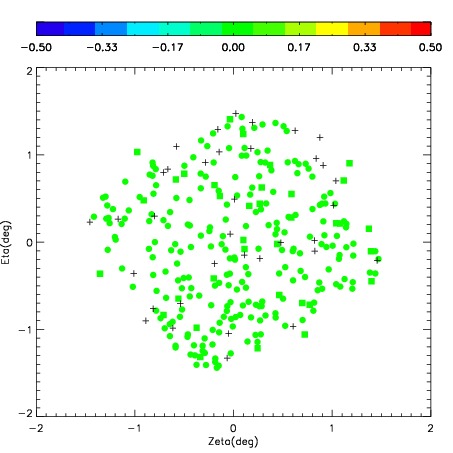
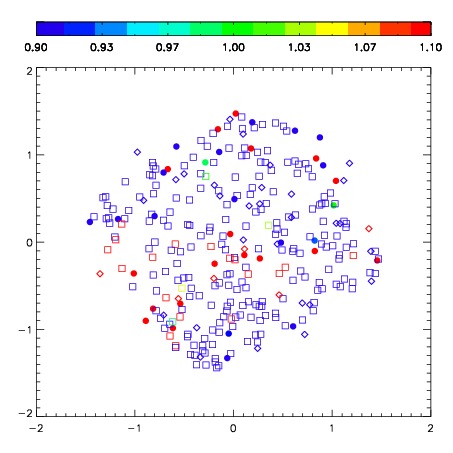
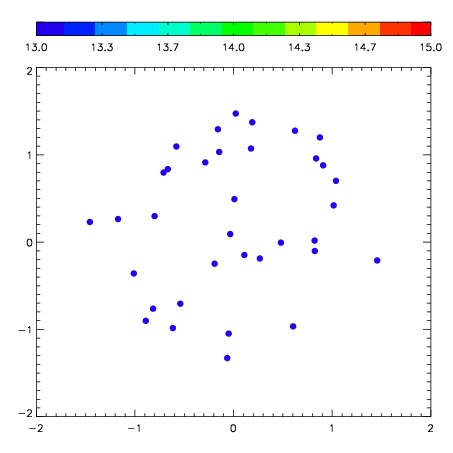
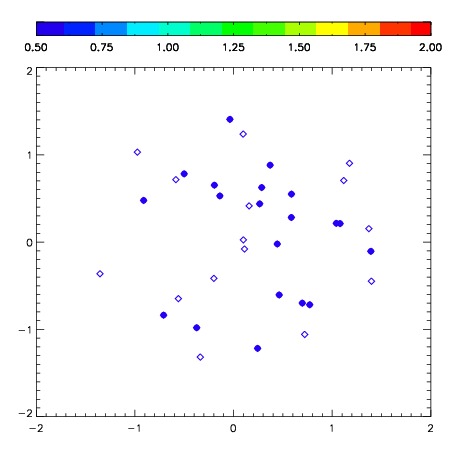
| Frame | Nreads | Zeropoints | Mag plots | Spatial mag deviation | Spatial sky 16325A emission deviations (filled: sky, open: star) | Spatial sky continuum emission | Spatial sky telluric CO2 absorption deviations (filled: H < 10) | |||||||||||||||||||||||
| 0 | 0 |
|
|
|
|
|
|
| IPAIR | NAME | SHIFT | NEWSHIFT | S/N | NAME | SHIFT | NEWSHIFT | S/N |
| 0 | 08510046 | 0.301381 | 0.00000 | 298.618 | 08510047 | 0.0151175 | 0.286263 | 298.587 |
| 1 | 08510042 | 0.292189 | 0.00919199 | 297.652 | 08510044 | 0.0142768 | 0.287104 | 295.368 |
| 2 | 08510045 | 0.280858 | 0.0205230 | 294.426 | 08510043 | 0.0201605 | 0.281220 | 291.082 |
| 3 | 08510041 | 0.292519 | 0.00886199 | 293.953 | 08510040 | 0.00000 | 0.301381 | 290.110 |