| Red | Green | Blue | |
| z | 17.64 | ||
| znorm | Inf | ||
| sky | -Inf | -Inf | -Inf |
| S/N | 18.7 | 26.5 | 27.6 |
| S/N(c) | 0.0 | 0.0 | 0.0 |
| SN(E/C) |

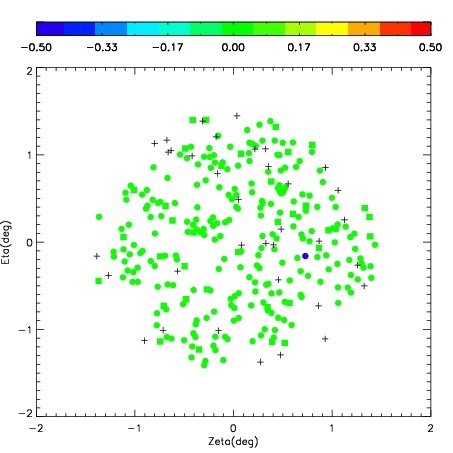
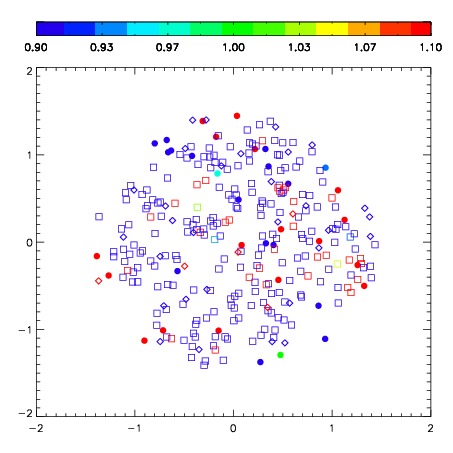


| Frame | Nreads | Zeropoints | Mag plots | Spatial mag deviation | Spatial sky 16325A emission deviations (filled: sky, open: star) | Spatial sky continuum emission | Spatial sky telluric CO2 absorption deviations (filled: H < 10) | |||||||||||||||||||||||
| 0 | 0 |
|
|
|
|
|
|
| IPAIR | NAME | SHIFT | NEWSHIFT | S/N | NAME | SHIFT | NEWSHIFT | S/N |
| 0 | 08980011 | 0.319242 | 0.00000 | 225.746 | 08980014 | 0.0339723 | 0.285270 | 127.629 |
| 1 | 08980012 | 0.277186 | 0.0420560 | 260.596 | 08980010 | 0.00000 | 0.319242 | 258.893 |
| 2 | 08980015 | 0.281744 | 0.0374980 | 257.763 | 08980013 | 0.0210985 | 0.298144 | 204.470 |