| Red | Green | Blue | |
| z | 17.64 | ||
| znorm | Inf | ||
| sky | -Inf | -Inf | -Inf |
| S/N | 18.3 | 29.4 | 29.1 |
| S/N(c) | 0.0 | 0.0 | 0.0 |
| SN(E/C) |


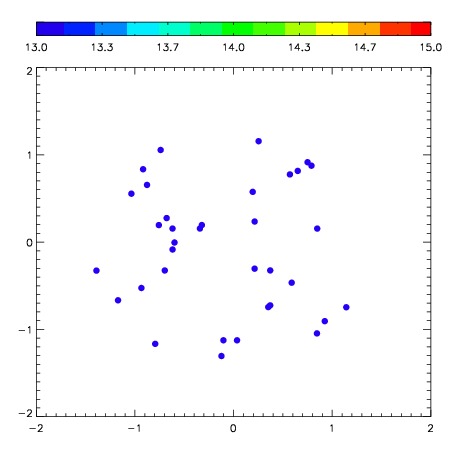
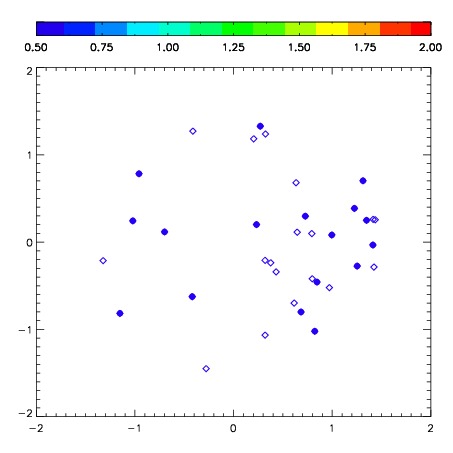
| Frame | Nreads | Zeropoints | Mag plots | Spatial mag deviation | Spatial sky 16325A emission deviations (filled: sky, open: star) | Spatial sky continuum emission | Spatial sky telluric CO2 absorption deviations (filled: H < 10) | |||||||||||||||||||||||
| 0 | 0 |
|
|
|
|
|
|
| IPAIR | NAME | SHIFT | NEWSHIFT | S/N | NAME | SHIFT | NEWSHIFT | S/N |
| 0 | 08570040 | 0.603454 | 0.00000 | 281.243 | 08570041 | 0.0857348 | 0.517719 | 276.008 |
| 1 | 08570039 | 0.601429 | 0.00202501 | 274.512 | 08570038 | 0.00000 | 0.603454 | 274.713 |