| Red | Green | Blue | |
| z | 17.64 | ||
| znorm | Inf | ||
| sky | -NaN | -Inf | -Inf |
| S/N | 23.2 | 38.0 | 37.6 |
| S/N(c) | 0.0 | 0.0 | 0.0 |
| SN(E/C) |
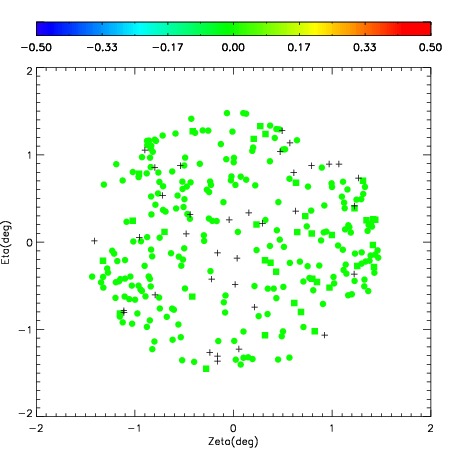
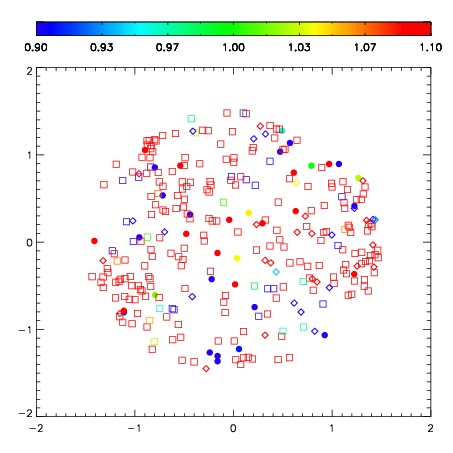


| Frame | Nreads | Zeropoints | Mag plots | Spatial mag deviation | Spatial sky 16325A emission deviations (filled: sky, open: star) | Spatial sky continuum emission | Spatial sky telluric CO2 absorption deviations (filled: H < 10) | |||||||||||||||||||||||
| 0 | 0 |
|
|
|
|
|
|
| IPAIR | NAME | SHIFT | NEWSHIFT | S/N | NAME | SHIFT | NEWSHIFT | S/N |
| 0 | 09780016 | 0.477537 | 0.00000 | 241.997 | 09780017 | -0.00168571 | 0.479223 | 225.900 |
| 1 | 09780019 | 0.473509 | 0.00402799 | 274.245 | 09780021 | -0.00887364 | 0.486411 | 263.160 |
| 2 | 09780020 | 0.468762 | 0.00877500 | 268.691 | 09780014 | 0.00000 | 0.477537 | 260.018 |
| 3 | 09780015 | 0.471968 | 0.00556901 | 264.415 | 09780018 | -0.00360006 | 0.481137 | 250.232 |