| Red | Green | Blue | |
| z | 17.64 | ||
| znorm | Inf | ||
| sky | -NaN | -NaN | -Inf |
| S/N | 25.6 | 43.8 | 46.3 |
| S/N(c) | 0.0 | 0.0 | 0.0 |
| SN(E/C) |

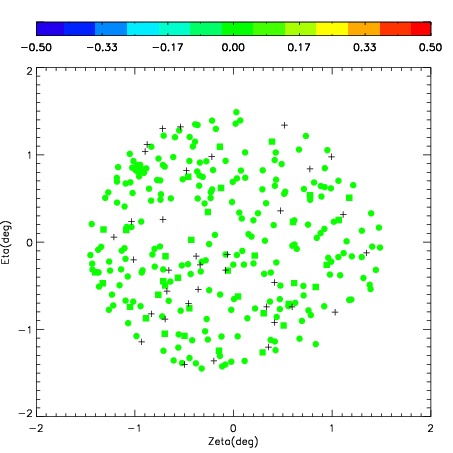


| Frame | Nreads | Zeropoints | Mag plots | Spatial mag deviation | Spatial sky 16325A emission deviations (filled: sky, open: star) | Spatial sky continuum emission | Spatial sky telluric CO2 absorption deviations (filled: H < 10) | |||||||||||||||||||||||
| 0 | 0 |
|
|
|
|
|
|
| IPAIR | NAME | SHIFT | NEWSHIFT | S/N | NAME | SHIFT | NEWSHIFT | S/N |
| 0 | 08660017 | 0.489643 | 0.00000 | 248.423 | 08660014 | 0.0497093 | 0.439934 | 247.552 |
| 1 | 08660016 | 0.485835 | 0.00380802 | 247.546 | 08660015 | 0.0530105 | 0.436633 | 244.939 |
| 2 | 08660012 | 0.481781 | 0.00786200 | 246.989 | 08660011 | 0.00000 | 0.489643 | 242.635 |
| 3 | 08660013 | 0.481994 | 0.00764900 | 245.925 | 08660018 | 0.0575305 | 0.432113 | 236.152 |