| Red | Green | Blue | |
| z | 17.64 | ||
| znorm | Inf | ||
| sky | -NaN | -Inf | -Inf |
| S/N | 29.6 | 42.4 | 43.0 |
| S/N(c) | 0.0 | 0.0 | 0.0 |
| SN(E/C) |
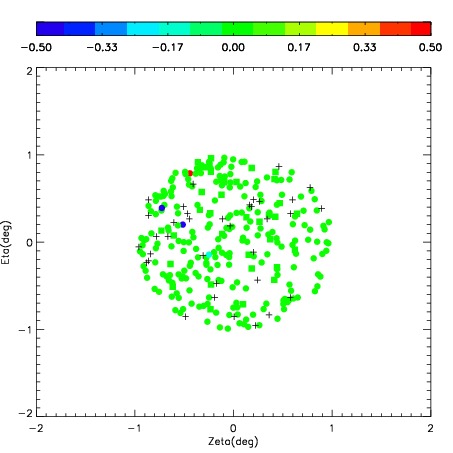
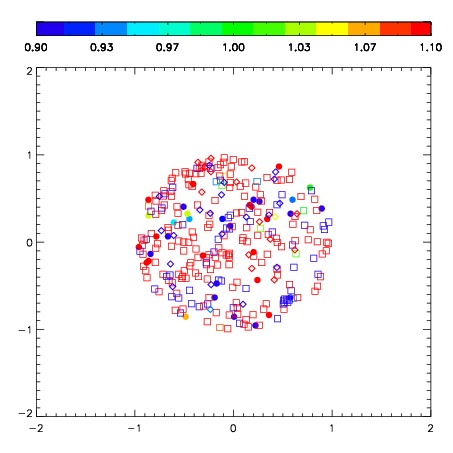


| Frame | Nreads | Zeropoints | Mag plots | Spatial mag deviation | Spatial sky 16325A emission deviations (filled: sky, open: star) | Spatial sky continuum emission | Spatial sky telluric CO2 absorption deviations (filled: H < 10) | |||||||||||||||||||||||
| 0 | 0 |
|
|
|
|
|
|
| IPAIR | NAME | SHIFT | NEWSHIFT | S/N | NAME | SHIFT | NEWSHIFT | S/N |
| 0 | 08710056 | 0.508410 | 0.00000 | 239.436 | 08710062 | 0.0627473 | 0.445663 | 224.241 |
| 1 | 08710060 | 0.495103 | 0.0133070 | 241.931 | 08710059 | 0.0709383 | 0.437472 | 227.945 |
| 2 | 08710057 | 0.502834 | 0.00557595 | 238.431 | 08710058 | 0.0789929 | 0.429417 | 219.286 |
| 3 | 08710061 | 0.505456 | 0.00295401 | 230.852 | 08710055 | 0.00000 | 0.508410 | 219.118 |