| Red | Green | Blue | |
| z | 17.64 | ||
| znorm | Inf | ||
| sky | -Inf | -Inf | -Inf |
| S/N | 23.8 | 40.6 | 44.9 |
| S/N(c) | 0.0 | 0.0 | 0.0 |
| SN(E/C) |

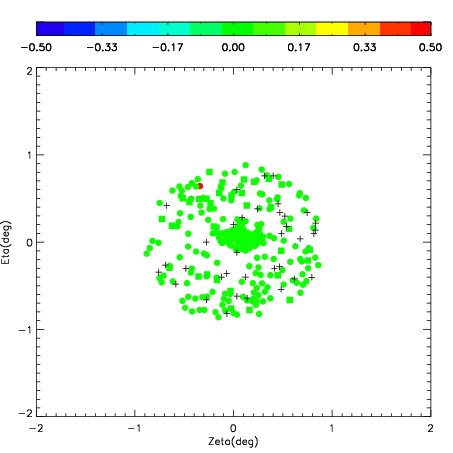


| Frame | Nreads | Zeropoints | Mag plots | Spatial mag deviation | Spatial sky 16325A emission deviations (filled: sky, open: star) | Spatial sky continuum emission | Spatial sky telluric CO2 absorption deviations (filled: H < 10) | |||||||||||||||||||||||
| 0 | 0 |
|
|
|
|
|
|
| IPAIR | NAME | SHIFT | NEWSHIFT | S/N | NAME | SHIFT | NEWSHIFT | S/N |
| 0 | 08510053 | 0.501085 | 0.00000 | 235.294 | 08510059 | 0.0343377 | 0.466747 | 226.779 |
| 1 | 08510056 | 0.480438 | 0.0206470 | 256.397 | 08510055 | 0.0411871 | 0.459898 | 249.227 |
| 2 | 08510052 | 0.499914 | 0.00117099 | 246.361 | 08510051 | 0.00000 | 0.501085 | 246.487 |
| 3 | 08510057 | 0.485179 | 0.0159060 | 244.412 | 08510054 | 0.0416464 | 0.459439 | 243.740 |
| 4 | 08510060 | 0.494995 | 0.00608999 | 223.691 | 08510058 | 0.0365839 | 0.464501 | 223.938 |