| Red | Green | Blue | |
| z | 17.64 | ||
| znorm | Inf | ||
| sky | -NaN | -Inf | -Inf |
| S/N | 23.8 | 40.5 | 45.1 |
| S/N(c) | 0.0 | 0.0 | 0.0 |
| SN(E/C) |

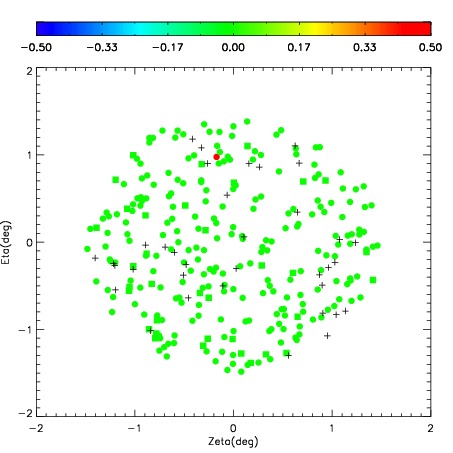
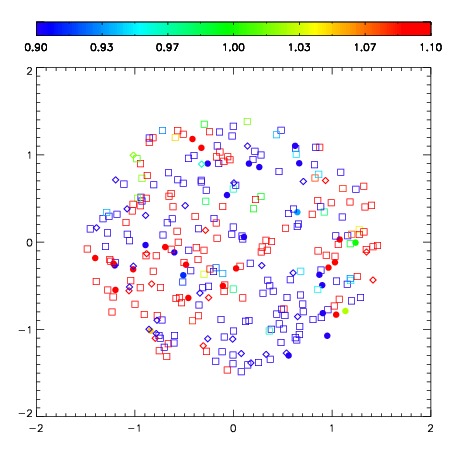


| Frame | Nreads | Zeropoints | Mag plots | Spatial mag deviation | Spatial sky 16325A emission deviations (filled: sky, open: star) | Spatial sky continuum emission | Spatial sky telluric CO2 absorption deviations (filled: H < 10) | |||||||||||||||||||||||
| 0 | 0 |
|
|
|
|
|
|
| IPAIR | NAME | SHIFT | NEWSHIFT | S/N | NAME | SHIFT | NEWSHIFT | S/N |
| 0 | 10450024 | 0.507733 | 0.00000 | 237.683 | 10450025 | 0.0308628 | 0.476870 | 240.999 |
| 1 | 10450023 | 0.506386 | 0.00134701 | 242.720 | 10450022 | 0.00000 | 0.507733 | 248.647 |
| 2 | 10450028 | 0.503195 | 0.00453800 | 242.503 | 10450029 | 0.0327672 | 0.474966 | 246.112 |
| 3 | 10450027 | 0.500783 | 0.00694996 | 230.086 | 10450026 | 0.0318787 | 0.475854 | 238.020 |