| Red | Green | Blue | |
| z | 17.64 | ||
| znorm | Inf | ||
| sky | -NaN | -NaN | -Inf |
| S/N | 21.2 | 36.4 | 38.6 |
| S/N(c) | 0.0 | 0.0 | 0.0 |
| SN(E/C) |

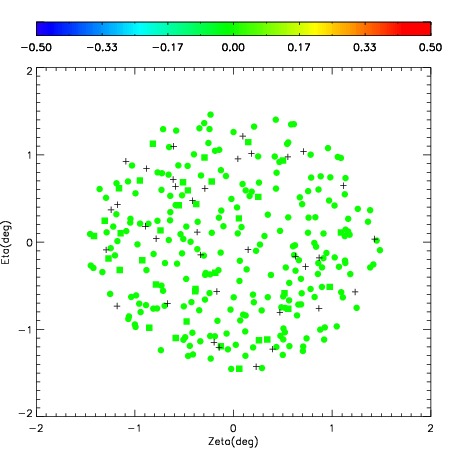
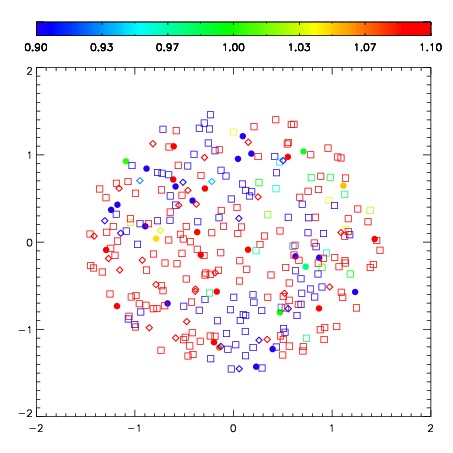


| Frame | Nreads | Zeropoints | Mag plots | Spatial mag deviation | Spatial sky 16325A emission deviations (filled: sky, open: star) | Spatial sky continuum emission | Spatial sky telluric CO2 absorption deviations (filled: H < 10) | |||||||||||||||||||||||
| 0 | 0 |
|
|
|
|
|
|
| IPAIR | NAME | SHIFT | NEWSHIFT | S/N | NAME | SHIFT | NEWSHIFT | S/N |
| 0 | 10610017 | 0.575068 | 0.00000 | 217.185 | 10610018 | 0.0846696 | 0.490398 | 205.183 |
| 1 | 10610012 | 0.560573 | 0.0144950 | 238.819 | 10610011 | 0.00000 | 0.575068 | 235.225 |
| 2 | 10610013 | 0.561967 | 0.0131010 | 236.957 | 10610015 | 0.0800192 | 0.495049 | 230.654 |
| 3 | 10610016 | 0.569484 | 0.00558400 | 219.059 | 10610014 | 0.0821734 | 0.492895 | 227.065 |