| Red | Green | Blue | |
| z | 17.64 | ||
| znorm | Inf | ||
| sky | -NaN | -NaN | -Inf |
| S/N | 29.5 | 46.2 | 48.0 |
| S/N(c) | 0.0 | 0.0 | 0.0 |
| SN(E/C) |

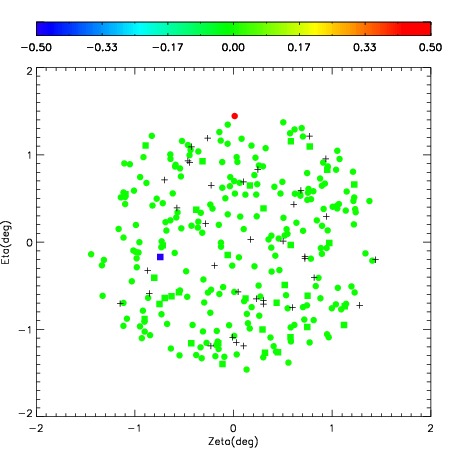
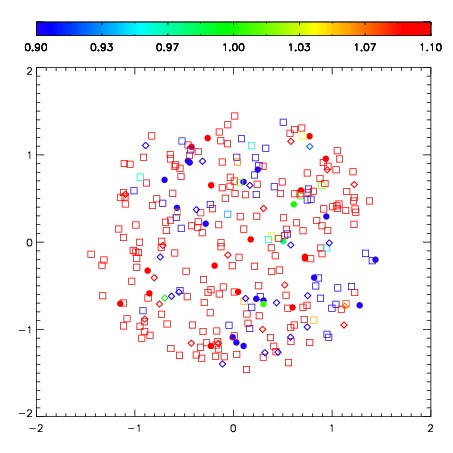


| Frame | Nreads | Zeropoints | Mag plots | Spatial mag deviation | Spatial sky 16325A emission deviations (filled: sky, open: star) | Spatial sky continuum emission | Spatial sky telluric CO2 absorption deviations (filled: H < 10) | |||||||||||||||||||||||
| 0 | 0 |
|
|
|
|
|
|
| IPAIR | NAME | SHIFT | NEWSHIFT | S/N | NAME | SHIFT | NEWSHIFT | S/N |
| 0 | 10310016 | 0.562913 | 0.00000 | 229.236 | 10310015 | 0.0764850 | 0.486428 | 226.632 |
| 1 | 10310012 | 0.554087 | 0.00882602 | 233.324 | 10310011 | 0.00000 | 0.562913 | 233.894 |
| 2 | 10310017 | 0.558124 | 0.00478899 | 232.126 | 10310018 | 0.0784677 | 0.484445 | 231.356 |
| 3 | 10310013 | 0.557293 | 0.00562000 | 227.461 | 10310014 | 0.0780082 | 0.484905 | 226.509 |