| Frame | Nreads | Zeropoints | Mag plots
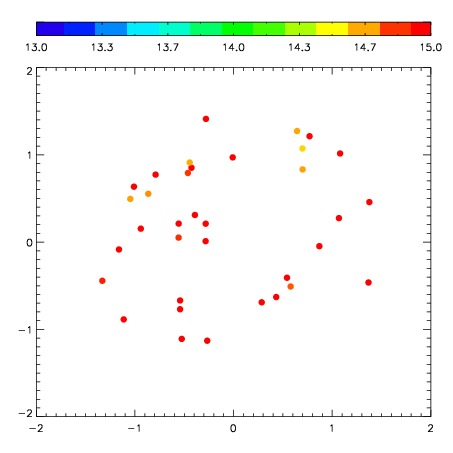
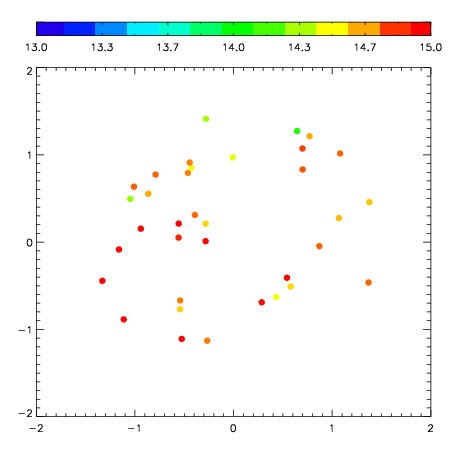
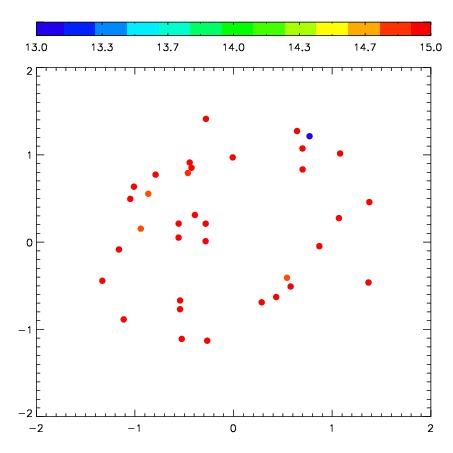
| Spatial mag deviation
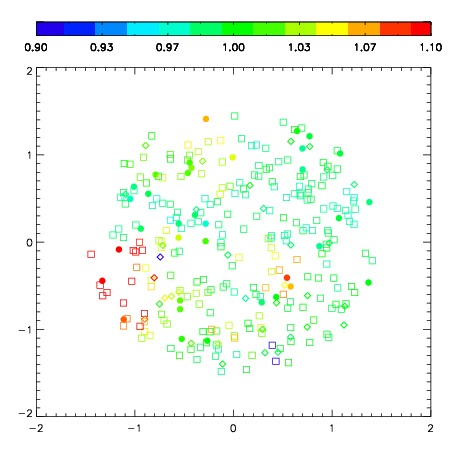
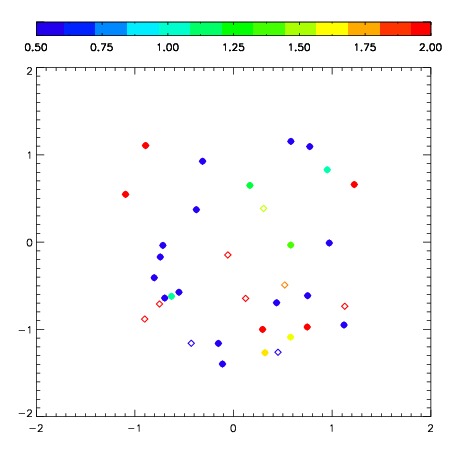
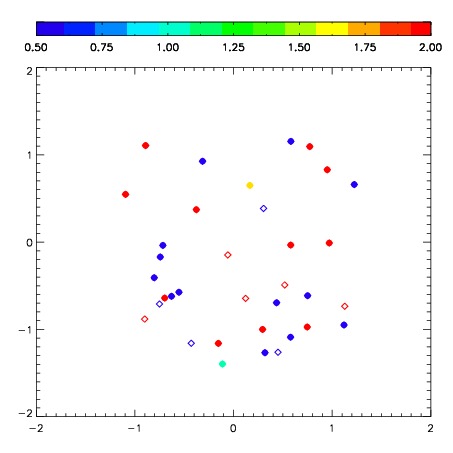
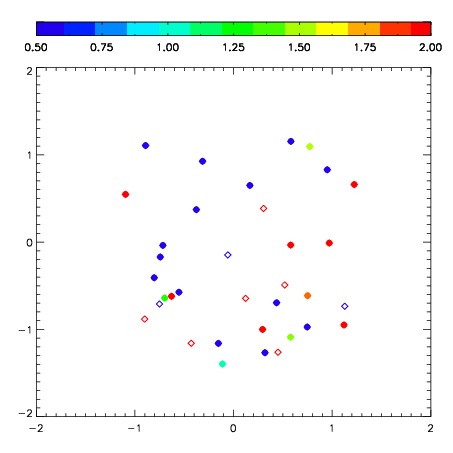
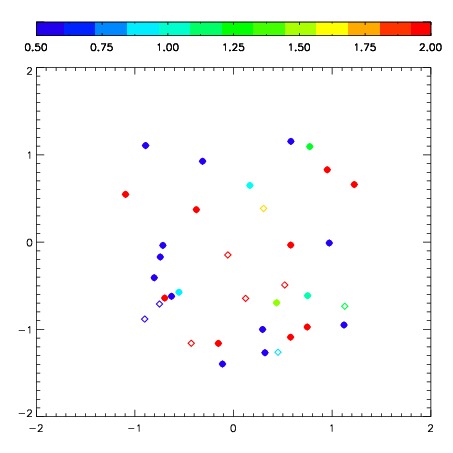
| Spatial sky 16325A emission deviations (filled: sky, open: star)
| Spatial sky continuum emission
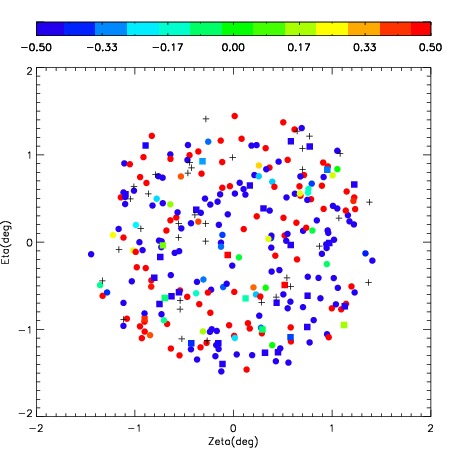
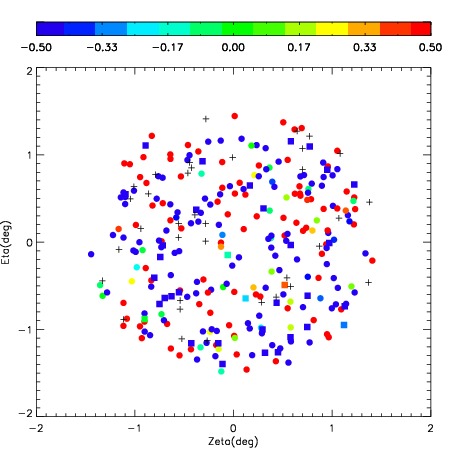
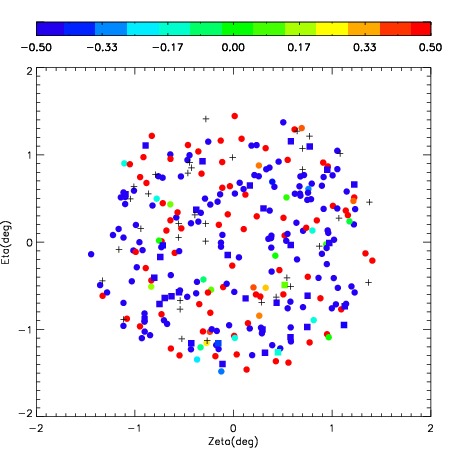
| Spatial sky telluric CO2 absorption deviations (filled: H < 10)
|
| 10370019
| 14
| | Red | Green | Blue
| | z | | 13.45
| | znorm | | 10.58
| | sky | 14.6 | 15.0 | 14.9
| | S/N | -0.0 | 0.4 | 0.4
| | S/N(c) | 0.0 | 0.0 | 0.0
| | SN(E/C) 1.15
|
| 
| 
| 
| 
| 
|
| 10370020
| 14
| | Red | Green | Blue
| | z | | 12.84
| | znorm | | 9.97
| | sky | 15.1 | 14.7 | 14.6
| | S/N | 0.1 | 0.2 | 0.2
| | S/N(c) | 0.0 | 0.0 | 0.0
| | SN(E/C) 1.97
|
| 
| 
| 
| 
| 
|
| 10370021
| 14
| | Red | Green | Blue
| | z | | 13.00
| | znorm | | 10.13
| | sky | 15.4 | 14.8 | 15.0
| | S/N | 0.1 | 0.1 | 0.2
| | S/N(c) | 0.0 | 0.0 | 0.0
| | SN(E/C) 1.82
|
| 
| 
| 
| 
| 
|
| 10370022
| 14
| | Red | Green | Blue
| | z | | 12.96
| | znorm | | 10.09
| | sky | 14.3 | 15.1 | 14.5
| | S/N | 0.2 | 0.3 | 0.1
| | S/N(c) | 0.0 | 0.0 | 0.0
| | SN(E/C) 1.96
|
| 
| 
| 
| 
| 
|