| Red | Green | Blue | |
| z | 17.64 | ||
| znorm | Inf | ||
| sky | -Inf | -Inf | -Inf |
| S/N | 29.9 | 48.8 | 52.8 |
| S/N(c) | 0.0 | 0.0 | 0.0 |
| SN(E/C) |
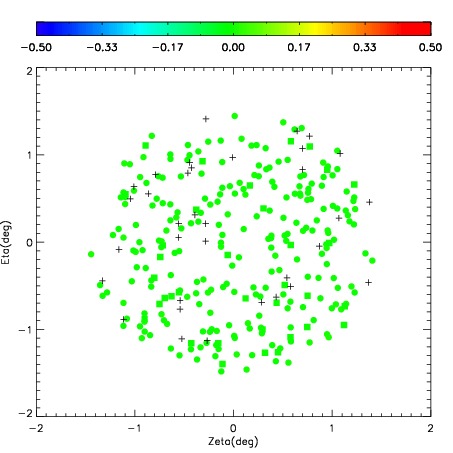


| Frame | Nreads | Zeropoints | Mag plots | Spatial mag deviation | Spatial sky 16325A emission deviations (filled: sky, open: star) | Spatial sky continuum emission | Spatial sky telluric CO2 absorption deviations (filled: H < 10) | |||||||||||||||||||||||
| 0 | 0 |
|
|
|
|
|
|
| IPAIR | NAME | SHIFT | NEWSHIFT | S/N | NAME | SHIFT | NEWSHIFT | S/N |
| 0 | 10440015 | 0.543496 | 0.00000 | 294.876 | 10440014 | 0.0709764 | 0.472520 | 288.987 |
| 1 | 10440016 | 0.536988 | 0.00650799 | 291.648 | 10440013 | 0.0700284 | 0.473468 | 288.987 |
| 2 | 10440011 | 0.535870 | 0.00762600 | 280.733 | 10440017 | 0.0851690 | 0.458327 | 286.169 |
| 3 | 10440012 | 0.542458 | 0.00103801 | 271.397 | 10440010 | 0.00000 | 0.543496 | 270.879 |