| Red | Green | Blue | |
| z | 17.64 | ||
| znorm | Inf | ||
| sky | -Inf | -Inf | -Inf |
| S/N | 33.5 | 50.6 | 55.7 |
| S/N(c) | 0.0 | 0.0 | 0.0 |
| SN(E/C) |
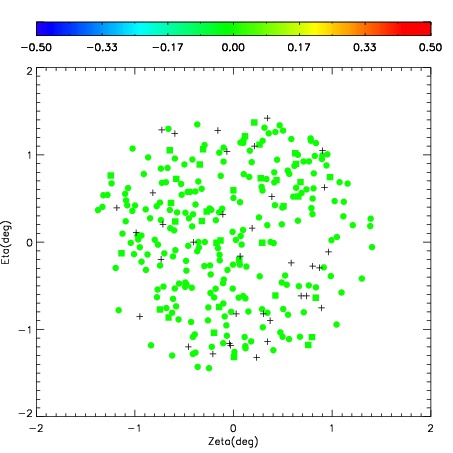
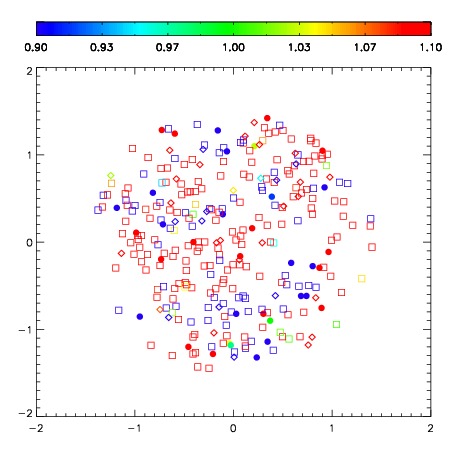
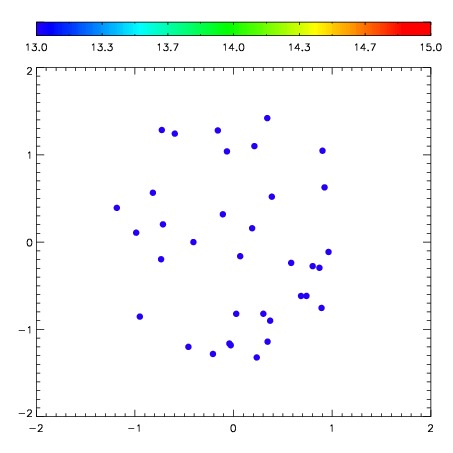
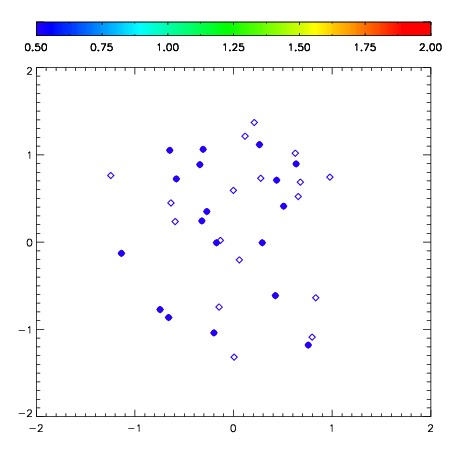
| Frame | Nreads | Zeropoints | Mag plots | Spatial mag deviation | Spatial sky 16325A emission deviations (filled: sky, open: star) | Spatial sky continuum emission | Spatial sky telluric CO2 absorption deviations (filled: H < 10) | |||||||||||||||||||||||
| 0 | 0 |
|
|
|
|
|
|
| IPAIR | NAME | SHIFT | NEWSHIFT | S/N | NAME | SHIFT | NEWSHIFT | S/N |
| 0 | 10540013 | 0.492119 | 0.00000 | 279.928 | 10540014 | 0.00992602 | 0.482193 | 285.372 |
| 1 | 10540016 | 0.484384 | 0.00773501 | 286.771 | 10540015 | 0.00652331 | 0.485596 | 286.165 |
| 2 | 10540017 | 0.484732 | 0.00738701 | 276.721 | 10540018 | 0.00919116 | 0.482928 | 271.956 |
| 3 | 10540012 | 0.482793 | 0.00932601 | 262.242 | 10540011 | 0.00000 | 0.492119 | 248.319 |