| Red | Green | Blue | |
| z | 17.64 | ||
| znorm | Inf | ||
| sky | -Inf | -Inf | -NaN |
| S/N | 22.9 | 35.1 | 38.1 |
| S/N(c) | 0.0 | 0.0 | 0.0 |
| SN(E/C) |
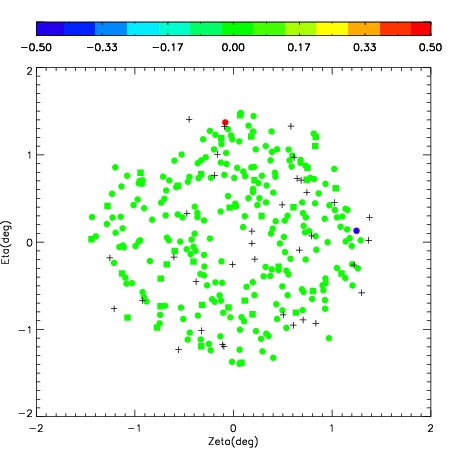

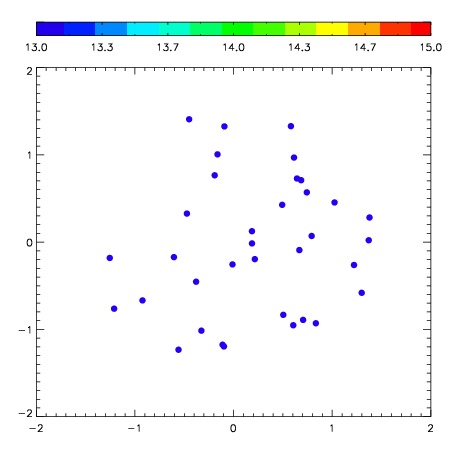

| Frame | Nreads | Zeropoints | Mag plots | Spatial mag deviation | Spatial sky 16325A emission deviations (filled: sky, open: star) | Spatial sky continuum emission | Spatial sky telluric CO2 absorption deviations (filled: H < 10) | |||||||||||||||||||||||
| 0 | 0 |
|
|
|
|
|
|
| IPAIR | NAME | SHIFT | NEWSHIFT | S/N | NAME | SHIFT | NEWSHIFT | S/N |
| 0 | 08890012 | 0.418941 | 0.00000 | 119.262 | 08890011 | 0.00000 | 0.418941 | 199.473 |
| 1 | 08890016 | 0.312800 | 0.106141 | 289.342 | 08890015 | 0.0101393 | 0.408802 | 287.461 |
| 2 | 08890017 | 0.308168 | 0.110773 | 280.278 | 08890018 | 0.00576594 | 0.413175 | 282.760 |
| 3 | 08890013 | 0.412700 | 0.00624099 | 168.021 | 08890014 | 0.0134244 | 0.405517 | 224.186 |