| Red | Green | Blue | |
| z | 17.64 | ||
| znorm | Inf | ||
| sky | -Inf | -Inf | -Inf |
| S/N | 19.9 | 29.2 | 31.2 |
| S/N(c) | 0.0 | 0.0 | 0.0 |
| SN(E/C) |

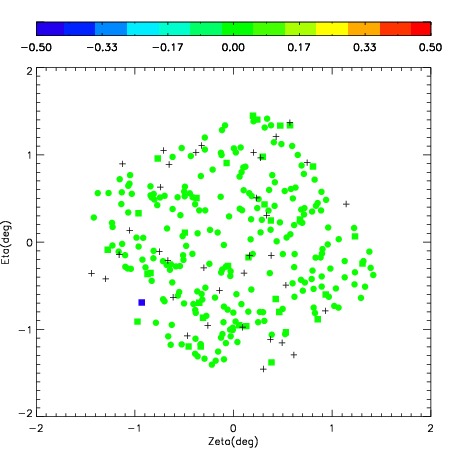
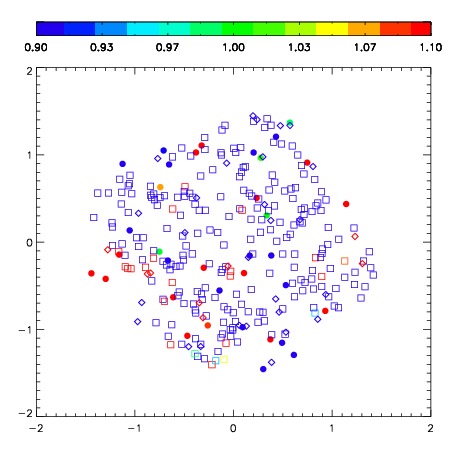

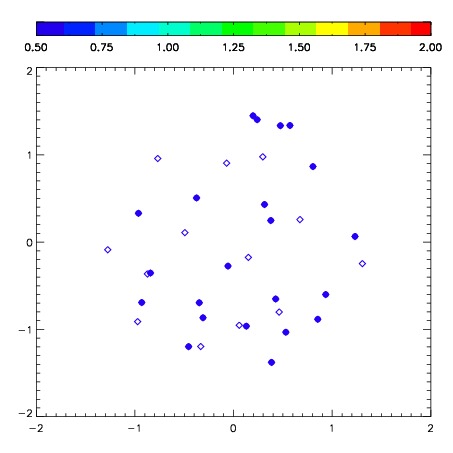
| Frame | Nreads | Zeropoints | Mag plots | Spatial mag deviation | Spatial sky 16325A emission deviations (filled: sky, open: star) | Spatial sky continuum emission | Spatial sky telluric CO2 absorption deviations (filled: H < 10) | |||||||||||||||||||||||
| 0 | 0 |
|
|
|
|
|
|
| IPAIR | NAME | SHIFT | NEWSHIFT | S/N | NAME | SHIFT | NEWSHIFT | S/N |
| 0 | 09010020 | 0.258822 | 0.00000 | 229.301 | 09010026 | 0.00836287 | 0.250459 | 244.639 |
| 1 | 09010021 | 0.250178 | 0.00864398 | 244.382 | 09010022 | 0.00721757 | 0.251604 | 257.666 |
| 2 | 09010024 | 0.245899 | 0.0129230 | 230.923 | 09010023 | 0.00711265 | 0.251709 | 250.833 |
| 3 | 09010025 | 0.253969 | 0.00485298 | 227.205 | 09010019 | 0.00000 | 0.258822 | 232.980 |