| Red | Green | Blue | |
| z | 17.64 | ||
| znorm | Inf | ||
| sky | -Inf | -Inf | -Inf |
| S/N | 6.6 | 13.0 | 15.1 |
| S/N(c) | 0.0 | 0.0 | 0.0 |
| SN(E/C) |


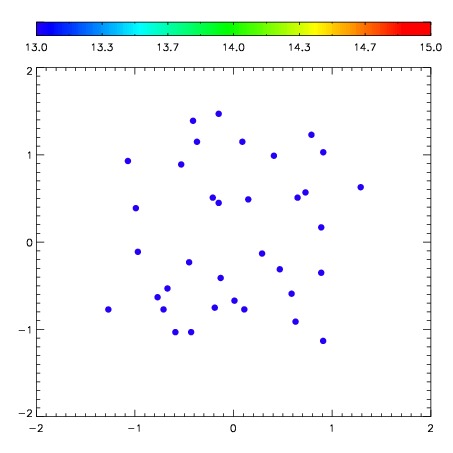
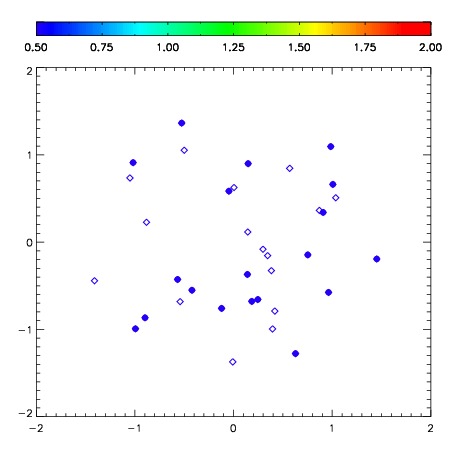
| Frame | Nreads | Zeropoints | Mag plots | Spatial mag deviation | Spatial sky 16325A emission deviations (filled: sky, open: star) | Spatial sky continuum emission | Spatial sky telluric CO2 absorption deviations (filled: H < 10) | |||||||||||||||||||||||
| 0 | 0 |
|
|
|
|
|
|
| IPAIR | NAME | SHIFT | NEWSHIFT | S/N | NAME | SHIFT | NEWSHIFT | S/N |
| 0 | 10550013 | 0.626227 | 0.00000 | 94.4679 | 10550014 | 0.138632 | 0.487595 | 157.455 |
| 1 | 10550017 | 0.621158 | 0.00506902 | 124.147 | 10550015 | 0.132823 | 0.493404 | 162.547 |
| 2 | 10550016 | 0.608176 | 0.0180510 | 50.3289 | 10550011 | 0.00000 | 0.626227 | 53.8831 |