| Red | Green | Blue | |
| z | 17.64 | ||
| znorm | Inf | ||
| sky | -NaN | -Inf | -Inf |
| S/N | 26.7 | 45.6 | 49.4 |
| S/N(c) | 0.0 | 0.0 | 0.0 |
| SN(E/C) |

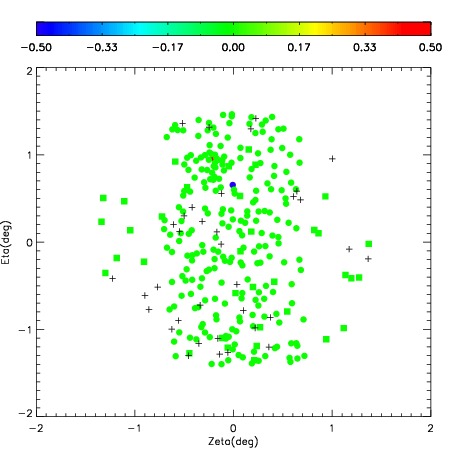


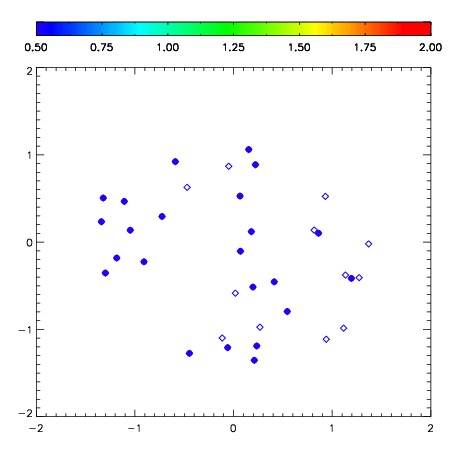
| Frame | Nreads | Zeropoints | Mag plots | Spatial mag deviation | Spatial sky 16325A emission deviations (filled: sky, open: star) | Spatial sky continuum emission | Spatial sky telluric CO2 absorption deviations (filled: H < 10) | |||||||||||||||||||||||
| 0 | 0 |
|
|
|
|
|
|
| IPAIR | NAME | SHIFT | NEWSHIFT | S/N | NAME | SHIFT | NEWSHIFT | S/N |
| 0 | 10490045 | 0.489312 | 0.00000 | 209.821 | 10490046 | 0.0248825 | 0.464429 | 204.284 |
| 1 | 10490041 | 0.474913 | 0.0143990 | 225.039 | 10490042 | 0.0224882 | 0.466824 | 229.364 |
| 2 | 10490040 | 0.475588 | 0.0137240 | 221.503 | 10490039 | 0.00000 | 0.489312 | 215.483 |
| 3 | 10490044 | 0.483473 | 0.00583899 | 211.592 | 10490043 | 0.0166590 | 0.472653 | 211.494 |