| Red | Green | Blue | |
| z | 17.64 | ||
| znorm | Inf | ||
| sky | -NaN | -Inf | -Inf |
| S/N | 24.2 | 42.5 | 46.5 |
| S/N(c) | 0.0 | 0.0 | 0.0 |
| SN(E/C) |
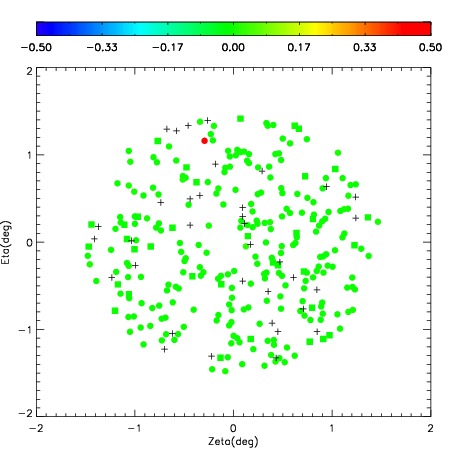
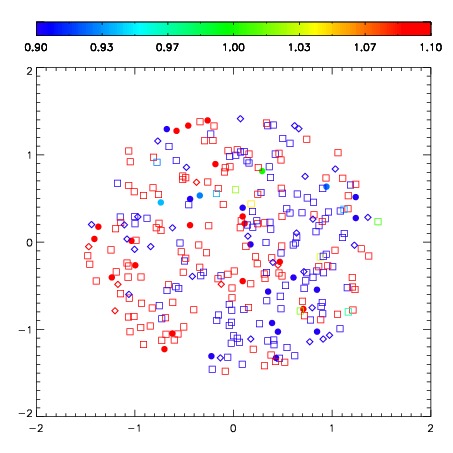
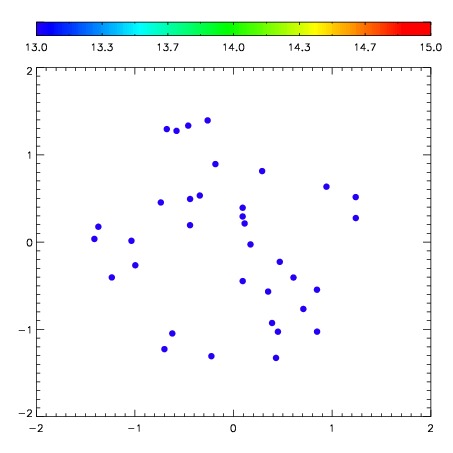
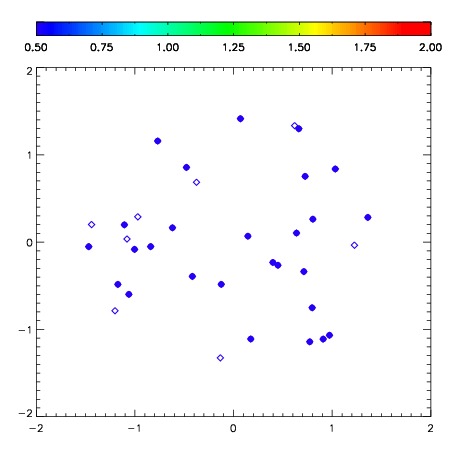
| Frame | Nreads | Zeropoints | Mag plots | Spatial mag deviation | Spatial sky 16325A emission deviations (filled: sky, open: star) | Spatial sky continuum emission | Spatial sky telluric CO2 absorption deviations (filled: H < 10) | |||||||||||||||||||||||
| 0 | 0 |
|
|
|
|
|
|
| IPAIR | NAME | SHIFT | NEWSHIFT | S/N | NAME | SHIFT | NEWSHIFT | S/N |
| 0 | 10540060 | 0.391519 | 0.00000 | 195.241 | 10540059 | 0.00000 | 0.391519 | 221.630 |
| 1 | 10540065 | 0.358792 | 0.0327270 | 292.900 | 10540066 | -0.00640172 | 0.397921 | 293.569 |
| 2 | 10540064 | 0.359645 | 0.0318740 | 288.407 | 10540062 | -0.00483188 | 0.396351 | 290.959 |
| 3 | 10540061 | 0.356874 | 0.0346450 | 283.635 | 10540063 | -0.000891984 | 0.392411 | 289.921 |