| Red | Green | Blue | |
| z | 17.64 | ||
| znorm | Inf | ||
| sky | -Inf | -Inf | -Inf |
| S/N | 12.1 | 21.2 | 19.8 |
| S/N(c) | 0.0 | 0.0 | 0.0 |
| SN(E/C) |

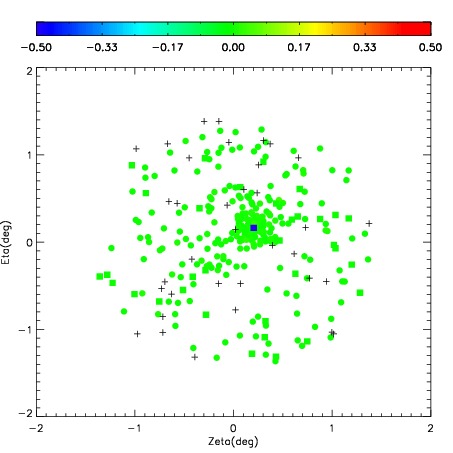
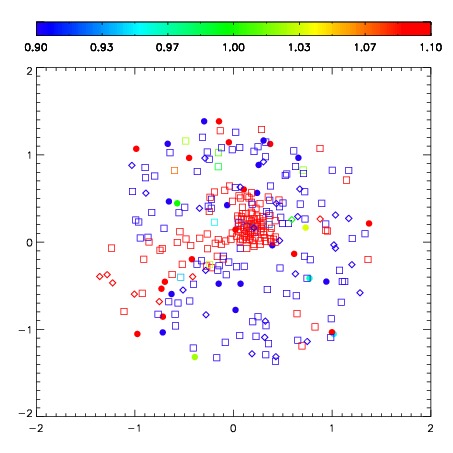
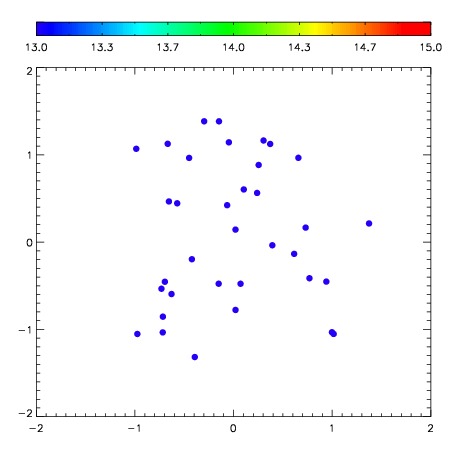
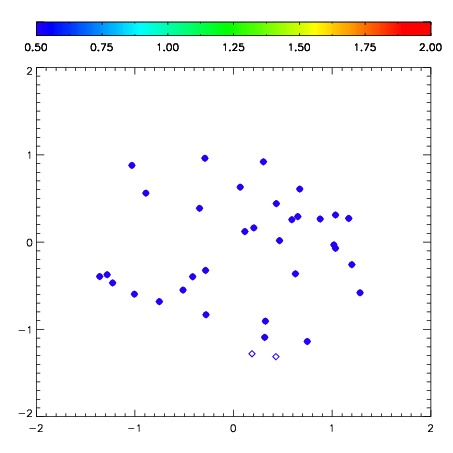
| Frame | Nreads | Zeropoints | Mag plots | Spatial mag deviation | Spatial sky 16325A emission deviations (filled: sky, open: star) | Spatial sky continuum emission | Spatial sky telluric CO2 absorption deviations (filled: H < 10) | |||||||||||||||||||||||
| 0 | 0 |
|
|
|
|
|
|
| IPAIR | NAME | SHIFT | NEWSHIFT | S/N | NAME | SHIFT | NEWSHIFT | S/N |
| 0 | 09990076 | 0.478603 | 0.00000 | 93.0125 | 09990078 | 0.103777 | 0.374826 | 100.164 |
| 1 | 09990080 | 0.430662 | 0.0479410 | 200.646 | 09990079 | 0.0604954 | 0.418108 | 209.757 |
| 2 | 09990077 | 0.457585 | 0.0210180 | 132.504 | 09990075 | 0.00000 | 0.478603 | 124.209 |