| Red | Green | Blue | |
| z | 17.64 | ||
| znorm | Inf | ||
| sky | -Inf | -NaN | -Inf |
| S/N | 23.0 | 41.3 | 46.0 |
| S/N(c) | 0.0 | 0.0 | 0.0 |
| SN(E/C) |


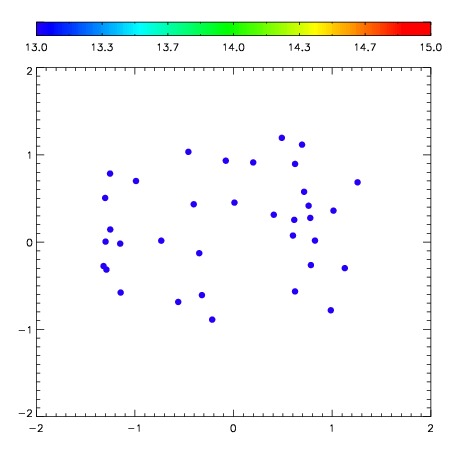
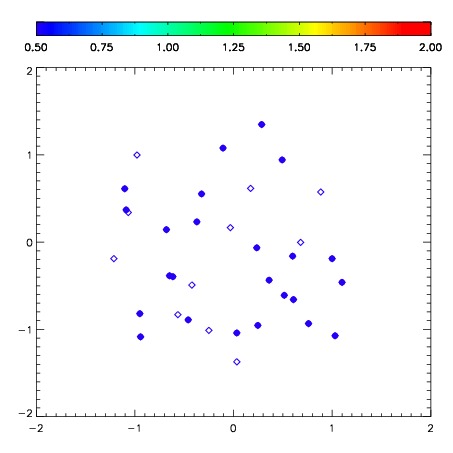
| Frame | Nreads | Zeropoints | Mag plots | Spatial mag deviation | Spatial sky 16325A emission deviations (filled: sky, open: star) | Spatial sky continuum emission | Spatial sky telluric CO2 absorption deviations (filled: H < 10) | |||||||||||||||||||||||
| 0 | 0 |
|
|
|
|
|
|
| IPAIR | NAME | SHIFT | NEWSHIFT | S/N | NAME | SHIFT | NEWSHIFT | S/N |
| 0 | 09970034 | 0.575336 | 0.00000 | 283.002 | 09970033 | 0.00000 | 0.575336 | 288.393 |
| 1 | 09970039 | 0.572262 | 0.00307399 | 297.676 | 09970040 | 0.0423775 | 0.532959 | 297.031 |
| 2 | 09970038 | 0.571410 | 0.00392598 | 296.192 | 09970036 | 0.0468745 | 0.528461 | 294.293 |
| 3 | 09970035 | 0.570359 | 0.00497699 | 290.828 | 09970037 | 0.0571418 | 0.518194 | 293.797 |