| Red | Green | Blue | |
| z | 17.64 | ||
| znorm | Inf | ||
| sky | -NaN | -NaN | -Inf |
| S/N | 23.1 | 41.6 | 45.9 |
| S/N(c) | 0.0 | 0.0 | 0.0 |
| SN(E/C) |
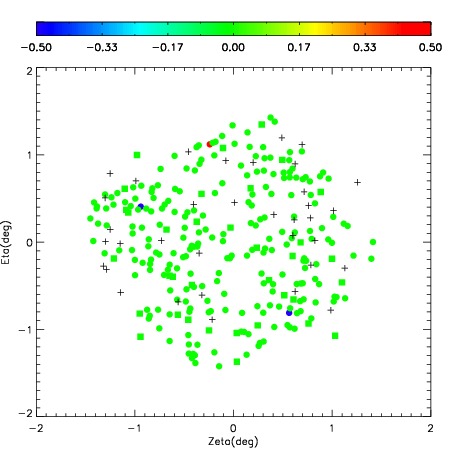

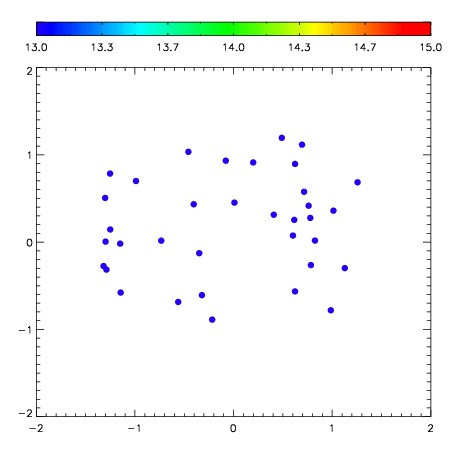
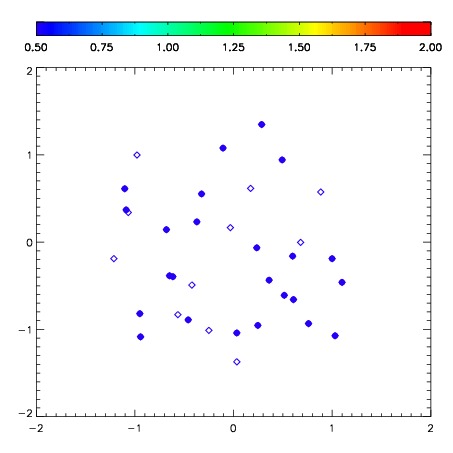
| Frame | Nreads | Zeropoints | Mag plots | Spatial mag deviation | Spatial sky 16325A emission deviations (filled: sky, open: star) | Spatial sky continuum emission | Spatial sky telluric CO2 absorption deviations (filled: H < 10) | |||||||||||||||||||||||
| 0 | 0 |
|
|
|
|
|
|
| IPAIR | NAME | SHIFT | NEWSHIFT | S/N | NAME | SHIFT | NEWSHIFT | S/N |
| 0 | 09980023 | 0.619085 | 0.00000 | 300.126 | 09980026 | 0.0726348 | 0.546450 | 295.904 |
| 1 | 09980024 | 0.610784 | 0.00830102 | 297.803 | 09980022 | 0.00000 | 0.619085 | 295.193 |
| 2 | 09980027 | 0.616518 | 0.00256699 | 290.057 | 09980025 | 0.0794326 | 0.539652 | 292.620 |
| 3 | 09980028 | 0.604396 | 0.0146890 | 286.157 | 09980029 | 0.0716320 | 0.547453 | 288.671 |