| Red | Green | Blue | |
| z | 17.64 | ||
| znorm | Inf | ||
| sky | -Inf | -Inf | -Inf |
| S/N | 27.6 | 46.3 | 50.2 |
| S/N(c) | 0.0 | 0.0 | 0.0 |
| SN(E/C) |

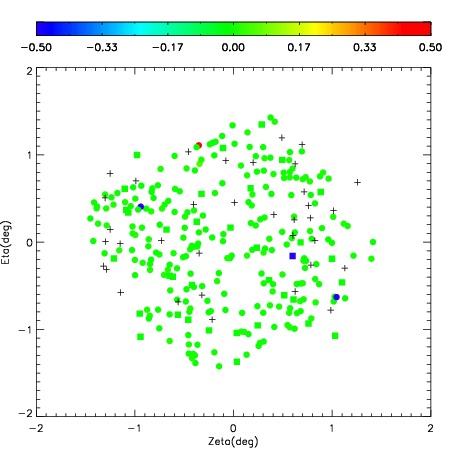
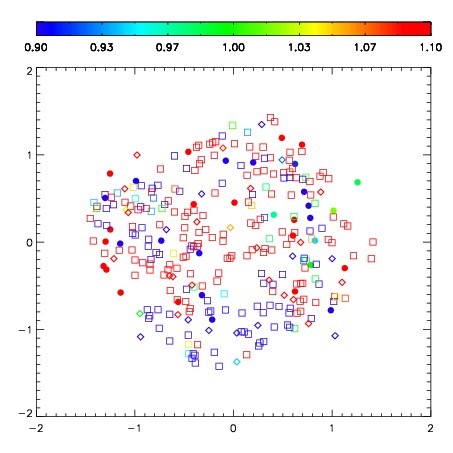


| Frame | Nreads | Zeropoints | Mag plots | Spatial mag deviation | Spatial sky 16325A emission deviations (filled: sky, open: star) | Spatial sky continuum emission | Spatial sky telluric CO2 absorption deviations (filled: H < 10) | |||||||||||||||||||||||
| 0 | 0 |
|
|
|
|
|
|
| IPAIR | NAME | SHIFT | NEWSHIFT | S/N | NAME | SHIFT | NEWSHIFT | S/N |
| 0 | 10230033 | 0.542306 | 0.00000 | 283.757 | 10230030 | 0.0464418 | 0.495864 | 285.016 |
| 1 | 10230029 | 0.535605 | 0.00670099 | 288.020 | 10230027 | 0.00000 | 0.542306 | 288.500 |
| 2 | 10230028 | 0.541092 | 0.00121403 | 283.783 | 10230034 | 0.0454322 | 0.496874 | 287.045 |
| 3 | 10230032 | 0.539920 | 0.00238603 | 282.524 | 10230031 | 0.0446687 | 0.497637 | 282.595 |