| Red | Green | Blue | |
| z | 17.64 | ||
| znorm | Inf | ||
| sky | -Inf | -Inf | -Inf |
| S/N | 35.6 | 60.3 | 63.8 |
| S/N(c) | 0.0 | 0.0 | 0.0 |
| SN(E/C) |
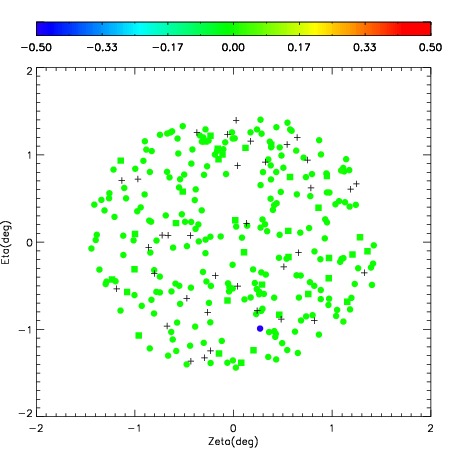
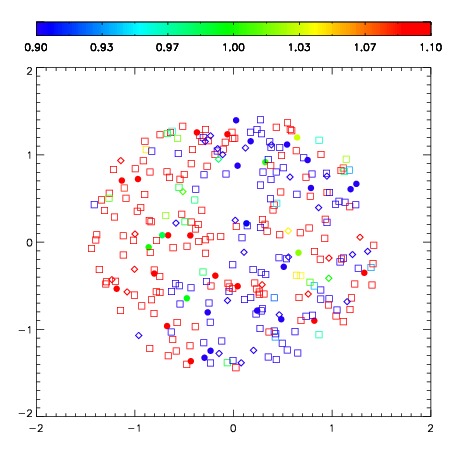
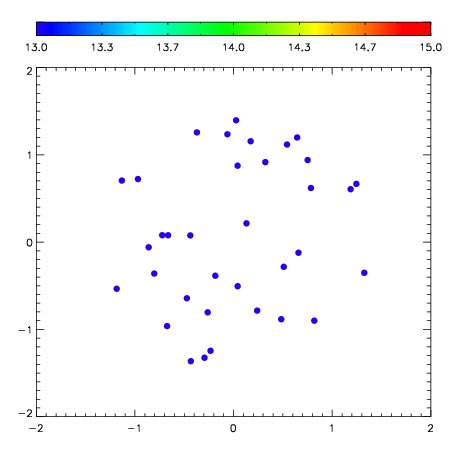
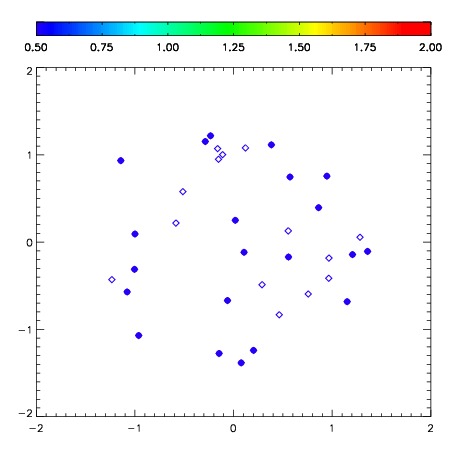
| Frame | Nreads | Zeropoints | Mag plots | Spatial mag deviation | Spatial sky 16325A emission deviations (filled: sky, open: star) | Spatial sky continuum emission | Spatial sky telluric CO2 absorption deviations (filled: H < 10) | |||||||||||||||||||||||
| 0 | 0 |
|
|
|
|
|
|
| IPAIR | NAME | SHIFT | NEWSHIFT | S/N | NAME | SHIFT | NEWSHIFT | S/N |
| 0 | 10290016 | 0.588973 | 0.00000 | 239.870 | 10290011 | 0.00000 | 0.588973 | 238.625 |
| 1 | 10290021 | 0.577163 | 0.0118100 | 255.291 | 10290019 | 0.122447 | 0.466526 | 255.262 |
| 2 | 10290020 | 0.577502 | 0.0114710 | 254.037 | 10290022 | 0.119928 | 0.469045 | 253.011 |
| 3 | 10290017 | 0.584616 | 0.00435698 | 250.141 | 10290018 | 0.119658 | 0.469315 | 250.544 |
| 4 | 10290012 | 0.584680 | 0.00429296 | 244.284 | 10290015 | 0.126249 | 0.462724 | 244.503 |
| 5 | 10290013 | 0.581003 | 0.00796998 | 233.832 | 10290014 | 0.128214 | 0.460759 | 233.754 |