| Red | Green | Blue | |
| z | 17.64 | ||
| znorm | Inf | ||
| sky | -Inf | -Inf | -Inf |
| S/N | 24.8 | 43.3 | 47.2 |
| S/N(c) | 0.0 | 0.0 | 0.0 |
| SN(E/C) |

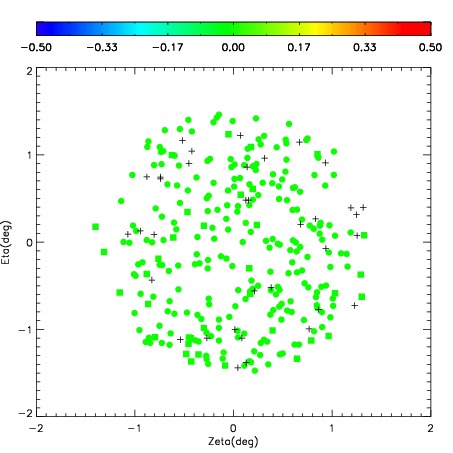
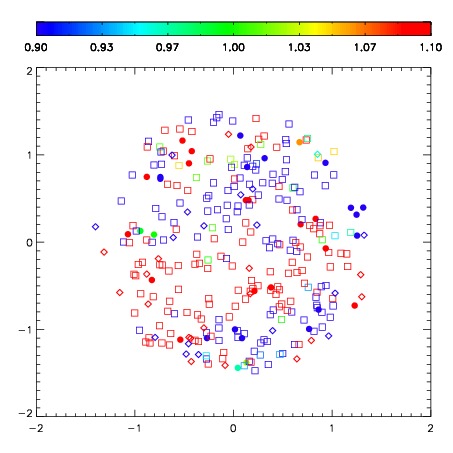
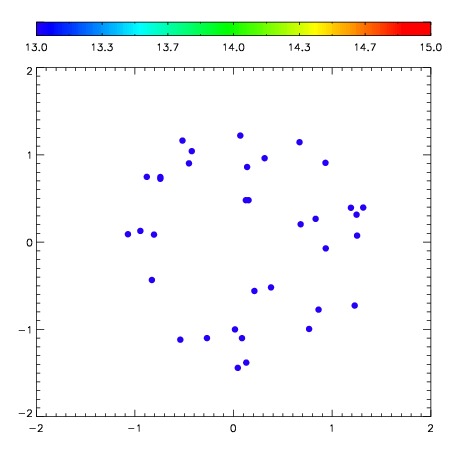
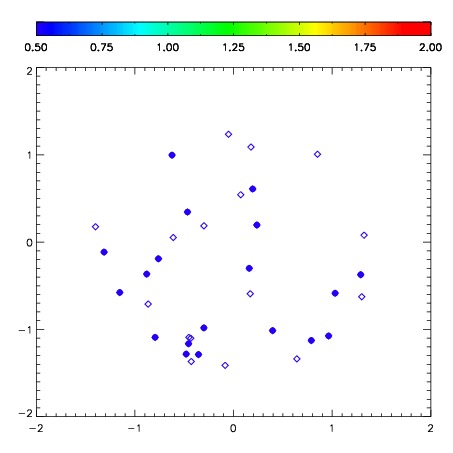
| Frame | Nreads | Zeropoints | Mag plots | Spatial mag deviation | Spatial sky 16325A emission deviations (filled: sky, open: star) | Spatial sky continuum emission | Spatial sky telluric CO2 absorption deviations (filled: H < 10) | |||||||||||||||||||||||
| 0 | 0 |
|
|
|
|
|
|
| IPAIR | NAME | SHIFT | NEWSHIFT | S/N | NAME | SHIFT | NEWSHIFT | S/N |
| 0 | 10540075 | 0.447406 | 0.00000 | 270.514 | 10540070 | 0.00000 | 0.447406 | 265.423 |
| 1 | 10540072 | 0.444968 | 0.00243801 | 279.320 | 10540074 | -0.00926577 | 0.456672 | 276.113 |
| 2 | 10540071 | 0.443485 | 0.00392100 | 271.926 | 10540073 | -0.00697878 | 0.454385 | 267.979 |
| 3 | 10540076 | 0.445139 | 0.00226700 | 227.023 | 10540077 | -0.00213078 | 0.449537 | 180.496 |