| Red | Green | Blue | |
| z | 17.64 | ||
| znorm | Inf | ||
| sky | -NaN | -NaN | -Inf |
| S/N | 29.6 | 48.8 | 52.8 |
| S/N(c) | 0.0 | 0.0 | 0.0 |
| SN(E/C) |

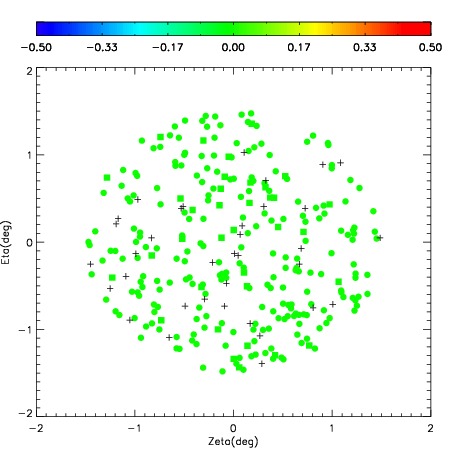
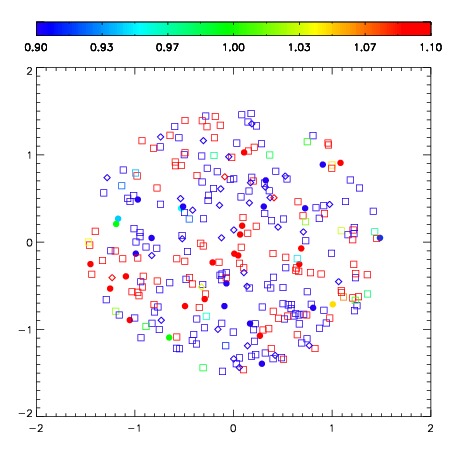
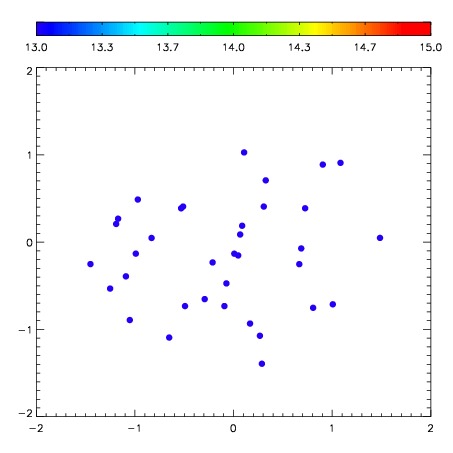
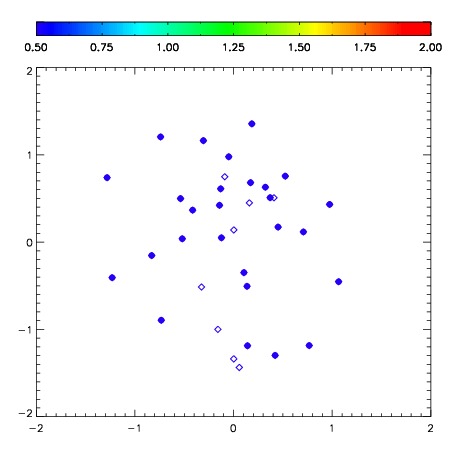
| Frame | Nreads | Zeropoints | Mag plots | Spatial mag deviation | Spatial sky 16325A emission deviations (filled: sky, open: star) | Spatial sky continuum emission | Spatial sky telluric CO2 absorption deviations (filled: H < 10) | |||||||||||||||||||||||
| 0 | 0 |
|
|
|
|
|
|
| IPAIR | NAME | SHIFT | NEWSHIFT | S/N | NAME | SHIFT | NEWSHIFT | S/N |
| 0 | 10310040 | 0.426670 | 0.00000 | 294.549 | 10310038 | 0.0406425 | 0.386028 | 288.568 |
| 1 | 10310037 | 0.413337 | 0.0133330 | 301.766 | 10310031 | 0.00000 | 0.426670 | 298.478 |
| 2 | 10310036 | 0.415331 | 0.0113390 | 300.515 | 10310035 | 0.0379342 | 0.388736 | 298.001 |
| 3 | 10310032 | 0.393981 | 0.0326890 | 298.203 | 10310034 | 0.0414457 | 0.385224 | 296.265 |
| 4 | 10310033 | 0.395537 | 0.0311330 | 295.037 | 10310039 | 0.0341597 | 0.392510 | 292.030 |