| Red | Green | Blue | |
| z | 17.64 | ||
| znorm | Inf | ||
| sky | -Inf | -Inf | -Inf |
| S/N | 27.5 | 44.7 | 47.2 |
| S/N(c) | 0.0 | 0.0 | 0.0 |
| SN(E/C) |


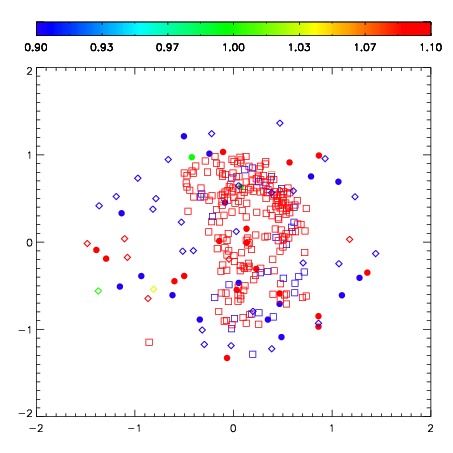


| Frame | Nreads | Zeropoints | Mag plots | Spatial mag deviation | Spatial sky 16325A emission deviations (filled: sky, open: star) | Spatial sky continuum emission | Spatial sky telluric CO2 absorption deviations (filled: H < 10) | |||||||||||||||||||||||
| 0 | 0 |
|
|
|
|
|
|
| IPAIR | NAME | SHIFT | NEWSHIFT | S/N | NAME | SHIFT | NEWSHIFT | S/N |
| 0 | 10250084 | 0.553495 | 0.00000 | 277.080 | 10250086 | 0.0681471 | 0.485348 | 278.508 |
| 1 | 10250089 | 0.548965 | 0.00453001 | 291.375 | 10250090 | 0.0686947 | 0.484800 | 292.309 |
| 2 | 10250088 | 0.551521 | 0.00197399 | 284.637 | 10250083 | 0.00000 | 0.553495 | 280.796 |
| 3 | 10250085 | 0.552834 | 0.000661016 | 269.257 | 10250087 | 0.0678986 | 0.485596 | 270.227 |