| Red | Green | Blue | |
| z | 17.64 | ||
| znorm | Inf | ||
| sky | -Inf | -Inf | -Inf |
| S/N | 23.0 | 41.6 | 46.0 |
| S/N(c) | 23.0 | 41.6 | 46.0 |
| SN(E/C) |
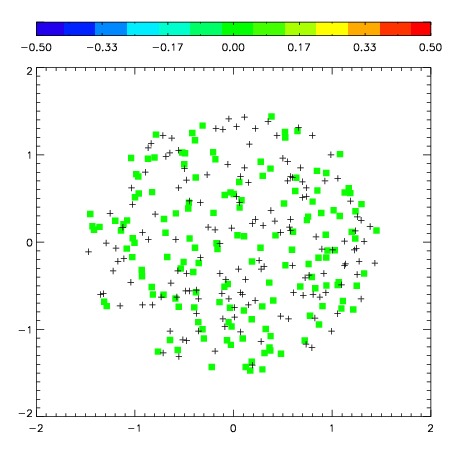
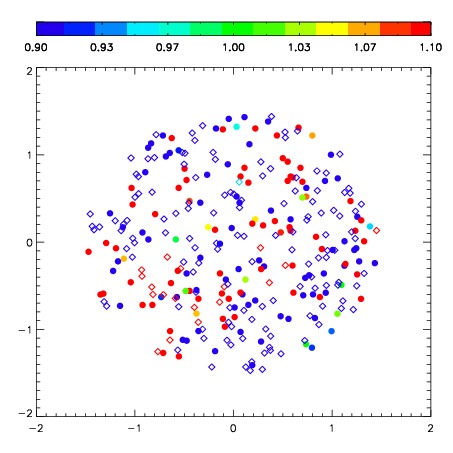

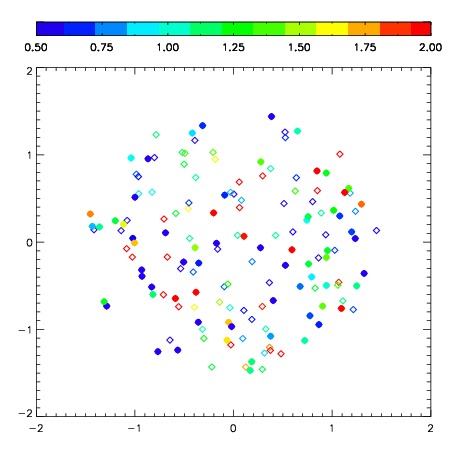
| Frame | Nreads | Zeropoints | Mag plots | Spatial mag deviation | Spatial sky 16325A emission deviations (filled: sky, open: star) | Spatial sky continuum emission | Spatial sky telluric CO2 absorption deviations (filled: H < 10) | |||||||||||||||||||||||
| 0 | 0 |
|
|
|
|
|
|
| 01650062 | 0.00000 | 190.278 |
| 01650063 | 0.00000 | 166.302 |
| 01650064 | 0.00000 | 105.762 |
| 01650065 | 0.00000 | 49.6163 |
| 01650066 | 0.00000 | 190.220 |
| 01650067 | 0.00000 | 176.082 |
| 01650068 | 0.00000 | 123.692 |
| 01650069 | 0.00000 | 61.2048 |
| 01650070 | 0.00000 | 191.085 |