| Frame | Nreads | Zeropoints | Mag plots
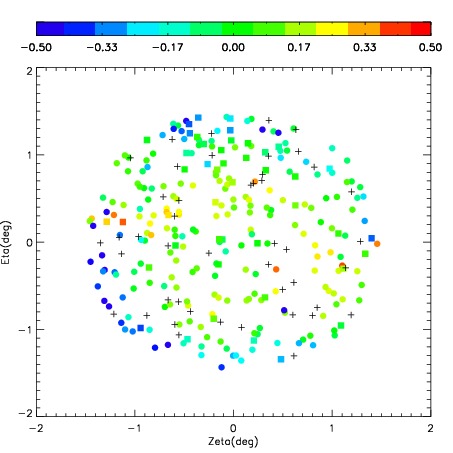
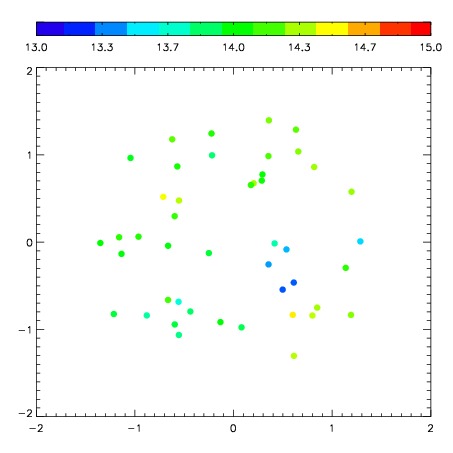
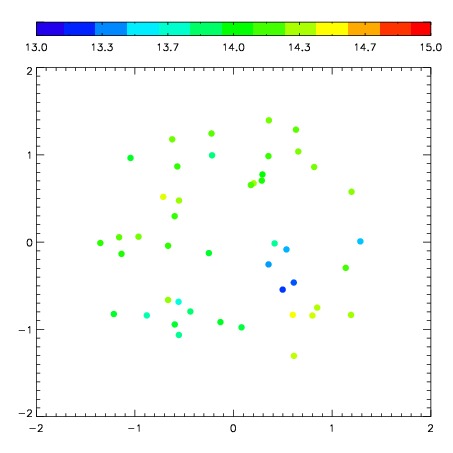
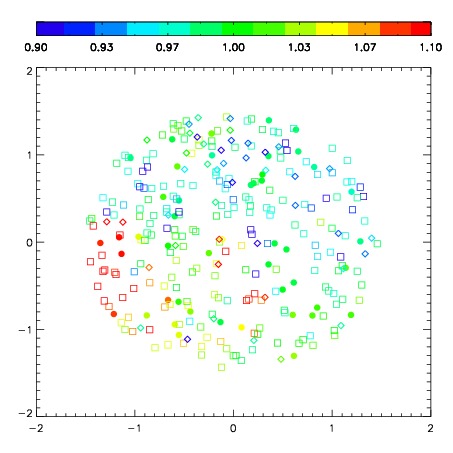
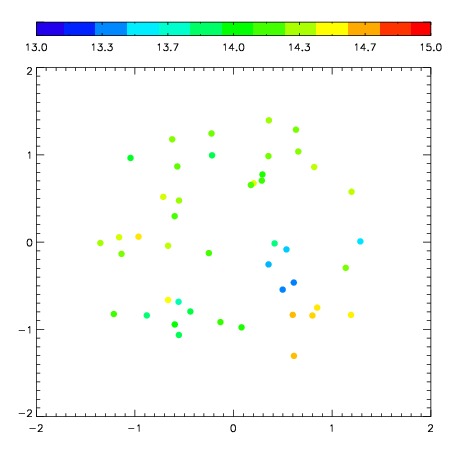
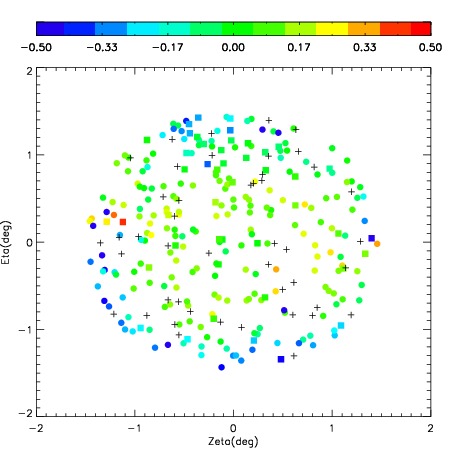
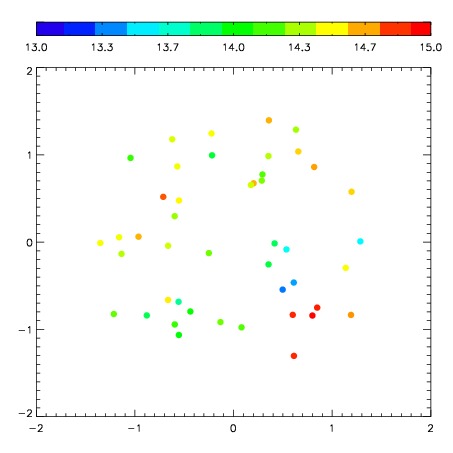
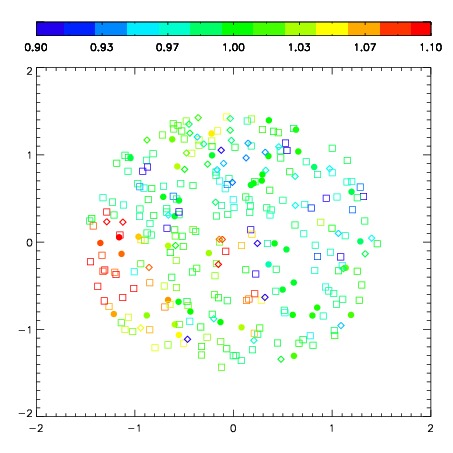
| Spatial mag deviation
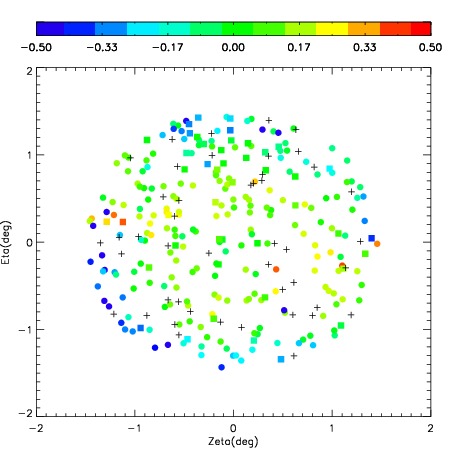
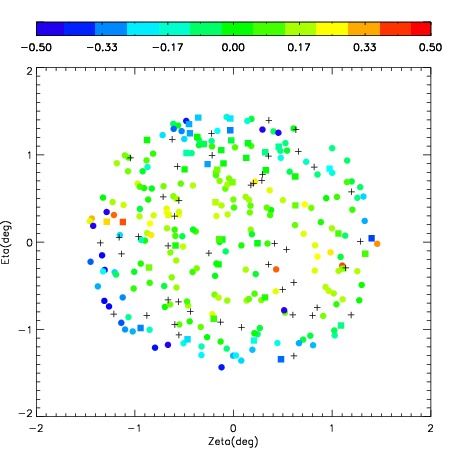
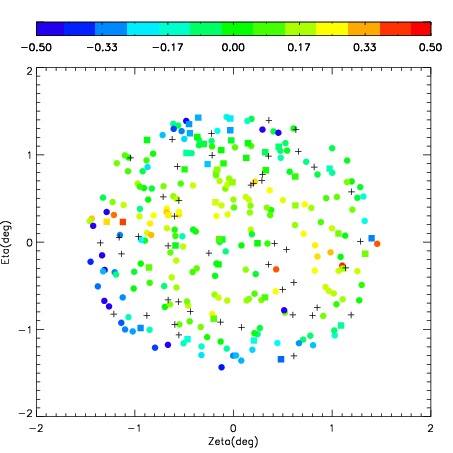
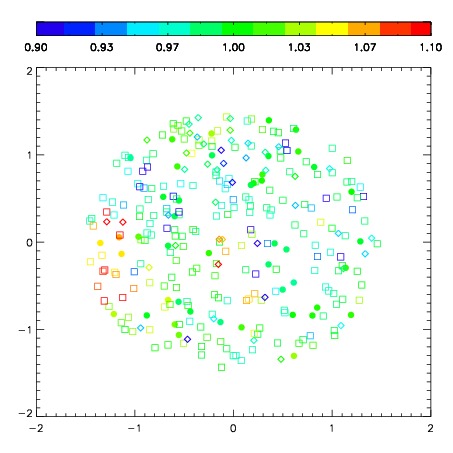
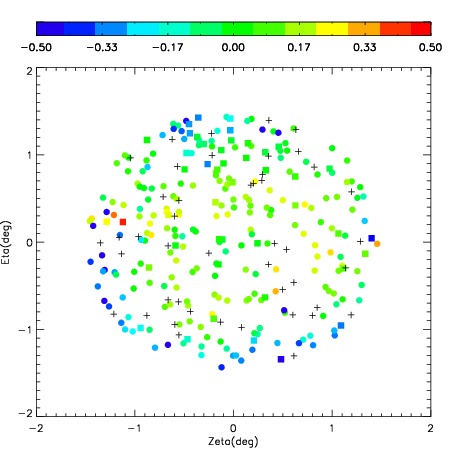
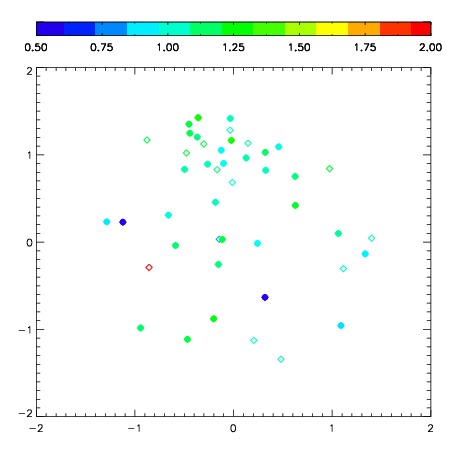
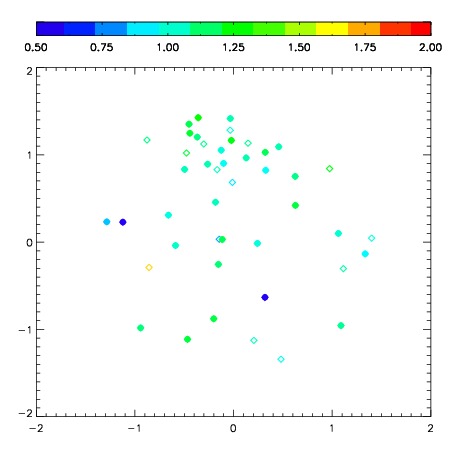
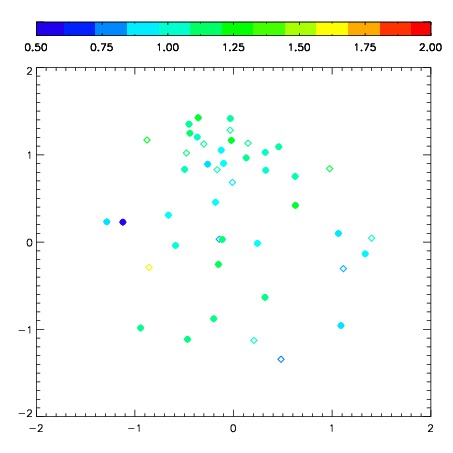
| Spatial sky 16325A emission deviations (filled: sky, open: star)
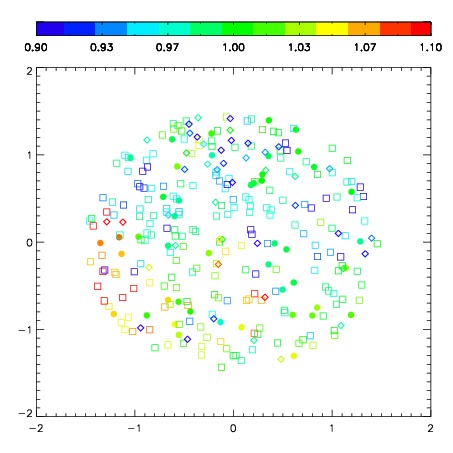
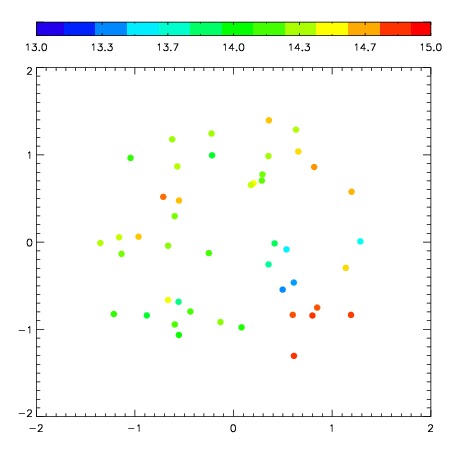
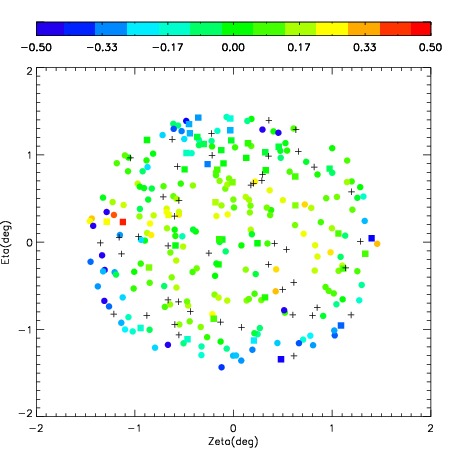
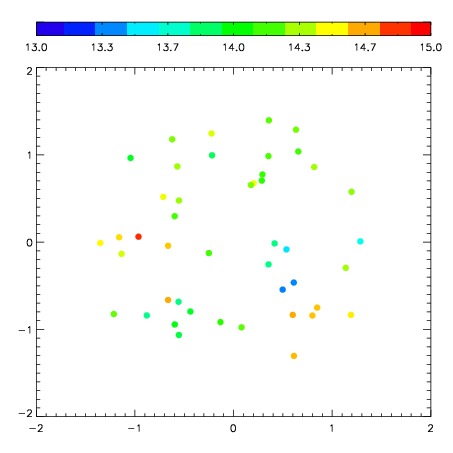
| Spatial sky continuum emission
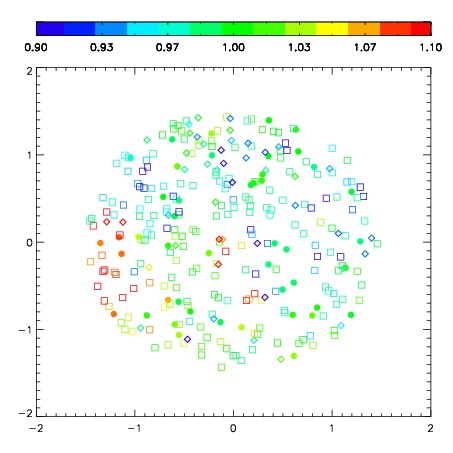
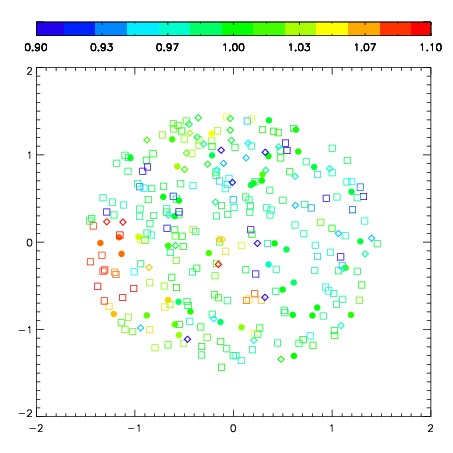
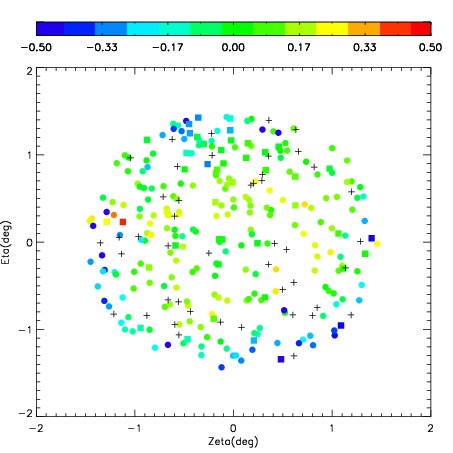
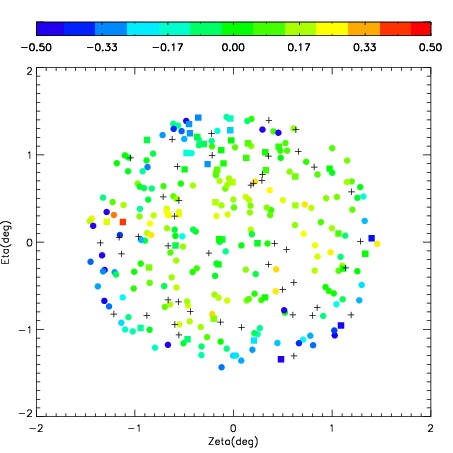
| Spatial sky telluric CO2 absorption deviations (filled: H < 10)
|
| 1660062
| 50
| | Red | Green | Blue
| | z | | 19.04
| | znorm | | 14.79
| | sky | 14.3 | 14.0 | 14.1
| | S/N | 15.4 | 24.1 | 26.2
| | S/N(c) | 13.8 | 22.7 | 25.2
| | SN(E/C) 0.87
|
| 
| 
| 
| 
| 
|
| 1660063
| 50
| | Red | Green | Blue
| | z | | 19.07
| | znorm | | 14.82
| | sky | 14.2 | 14.0 | 14.1
| | S/N | 15.9 | 24.9 | 26.7
| | S/N(c) | 14.2 | 23.5 | 25.7
| | SN(E/C) 0.91
|
| 
| 
| 
| 
| 
|
| 1660064
| 50
| | Red | Green | Blue
| | z | | 19.05
| | znorm | | 14.81
| | sky | 14.3 | 14.1 | 14.2
| | S/N | 15.5 | 24.5 | 26.3
| | S/N(c) | 14.0 | 23.4 | 25.5
| | SN(E/C) 0.87
|
| 
| 
| 
| 
| 
|
| 1660065
| 50
| | Red | Green | Blue
| | z | | 18.99
| | znorm | | 14.74
| | sky | 14.2 | 14.2 | 14.2
| | S/N | 15.0 | 24.1 | 25.2
| | S/N(c) | 13.5 | 22.9 | 24.8
| | SN(E/C) 0.89
|
| 
| 
| 
| 
| 
|
| 1660066
| 50
| | Red | Green | Blue
| | z | | 19.02
| | znorm | | 14.77
| | sky | 14.3 | 14.2 | 14.1
| | S/N | 15.3 | 23.9 | 25.5
| | S/N(c) | 13.8 | 22.9 | 25.2
| | SN(E/C) 0.89
|
| 
| 
| 
| 
| 
|
| 1660067
| 50
| | Red | Green | Blue
| | z | | 19.01
| | znorm | | 14.76
| | sky | 14.2 | 14.1 | 14.0
| | S/N | 14.4 | 22.6 | 24.2
| | S/N(c) | 12.6 | 21.1 | 23.5
| | SN(E/C) 0.92
|
| 
| 
| 
| 
| 
|
| 1660068
| 50
| | Red | Green | Blue
| | z | | 19.06
| | znorm | | 14.81
| | sky | 14.1 | 14.2 | 14.1
| | S/N | 15.0 | 24.0 | 26.0
| | S/N(c) | 13.2 | 22.5 | 25.2
| | SN(E/C) 0.91
|
| 
| 
| 
| 
| 
|
| 1660069
| 50
| | Red | Green | Blue
| | z | | 19.09
| | znorm | | 14.85
| | sky | 14.3 | 14.3 | 14.1
| | S/N | 16.0 | 24.6 | 26.5
| | S/N(c) | 13.8 | 23.2 | 26.0
| | SN(E/C) 0.91
|
| 
| 
| 
| 
| 
|
| 1660070
| 50
| | Red | Green | Blue
| | z | | 19.06
| | znorm | | 14.81
| | sky | 14.2 | 14.1 | 14.1
| | S/N | 16.0 | 25.0 | 26.2
| | S/N(c) | 14.0 | 23.6 | 25.8
| | SN(E/C) 0.90
|
| 
| 
| 
| 
| 
|
| 1660071
| 50
| | Red | Green | Blue
| | z | | 19.03
| | znorm | | 14.78
| | sky | 14.2 | 14.1 | 14.1
| | S/N | 15.7 | 24.6 | 26.2
| | S/N(c) | 13.9 | 23.0 | 25.9
| | SN(E/C) 0.93
|
| 
| 
| 
| 
| 
|
| 1660072
| 50
| | Red | Green | Blue
| | z | | 19.03
| | znorm | | 14.79
| | sky | 14.1 | 14.2 | 14.1
| | S/N | 15.4 | 24.2 | 26.1
| | S/N(c) | 13.7 | 22.7 | 25.7
| | SN(E/C) 0.89
|
| 
| 
| 
| 
| 
|