| Frame | Nreads | Zeropoints | Mag plots
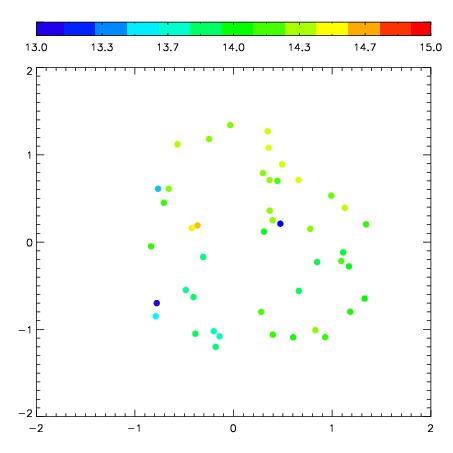
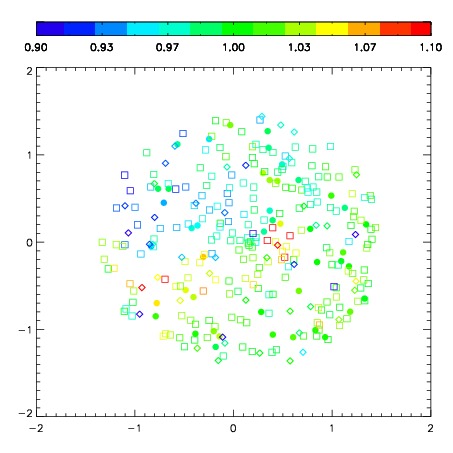
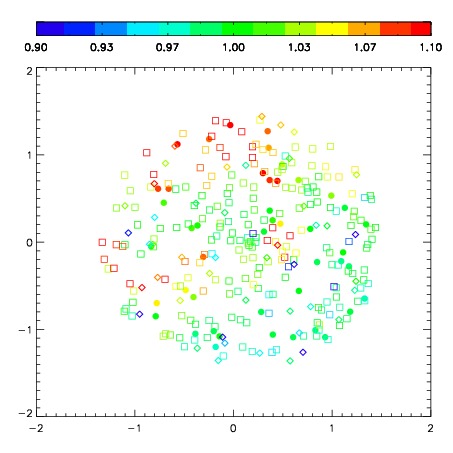
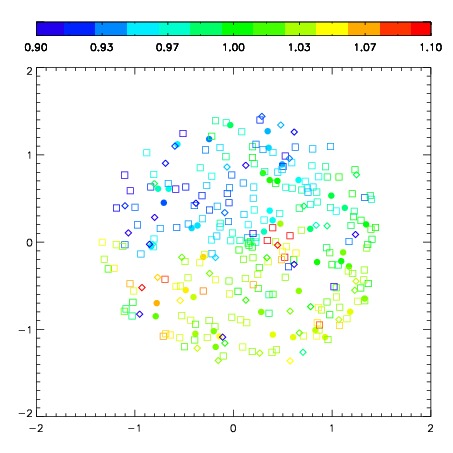
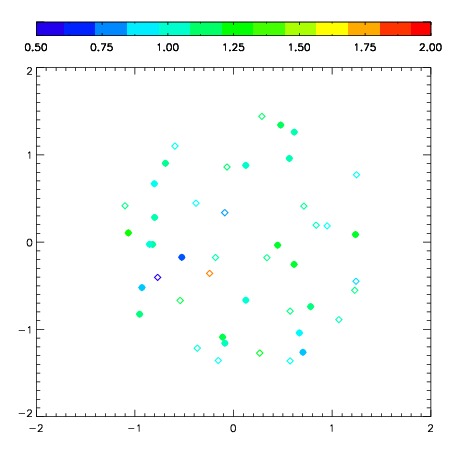
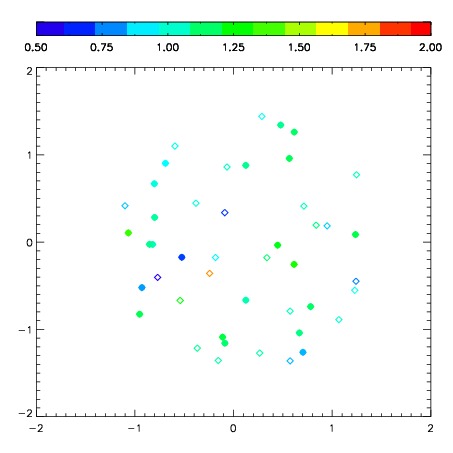
| Spatial mag deviation
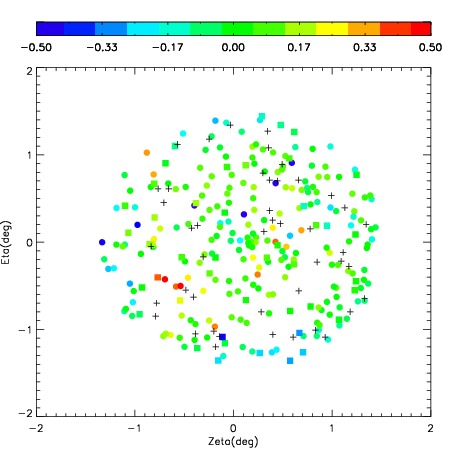
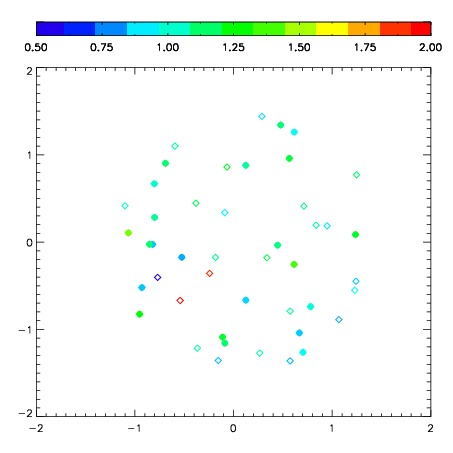
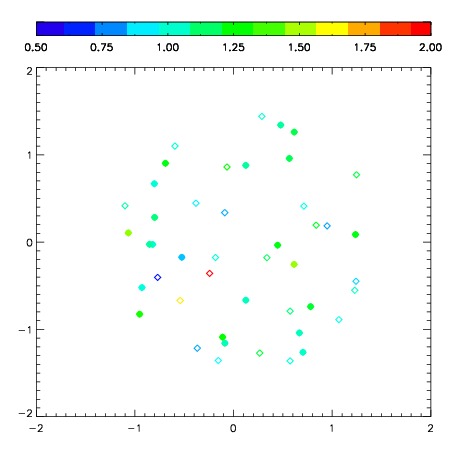
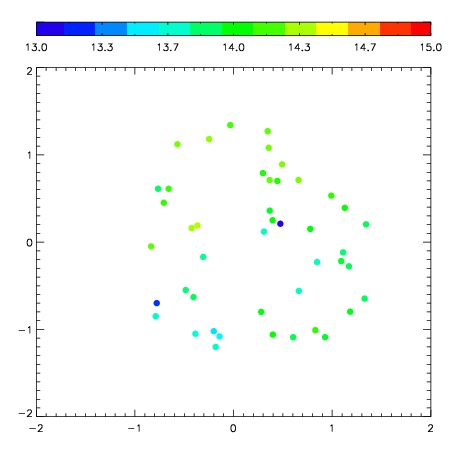
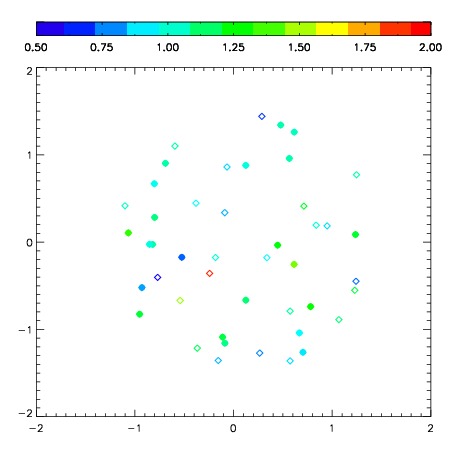
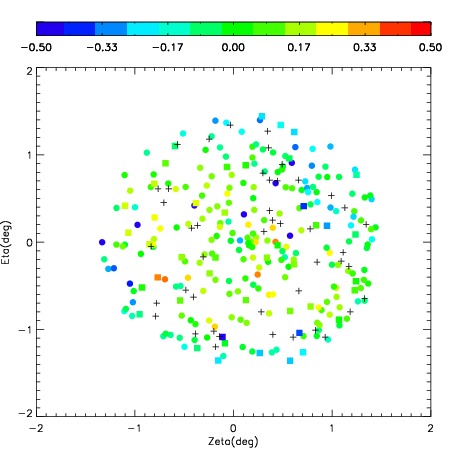
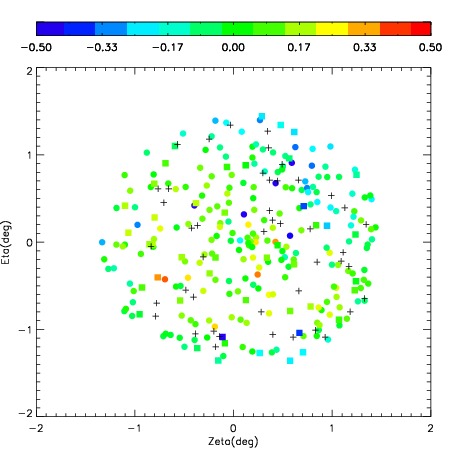
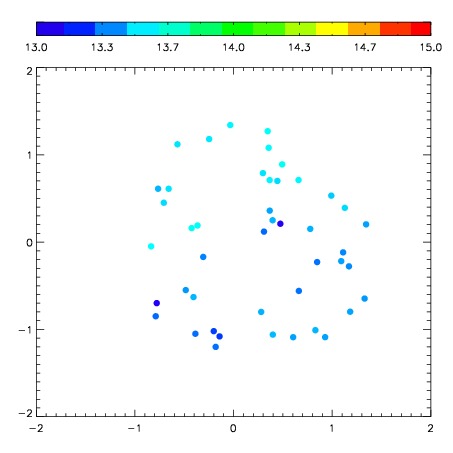
| Spatial sky 16325A emission deviations (filled: sky, open: star)
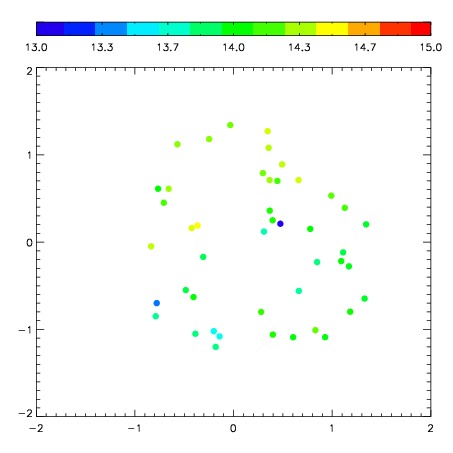
| Spatial sky continuum emission
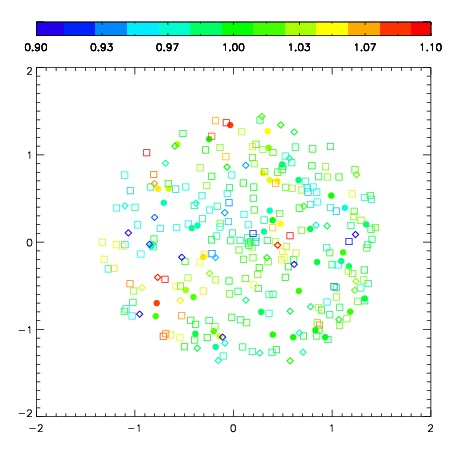
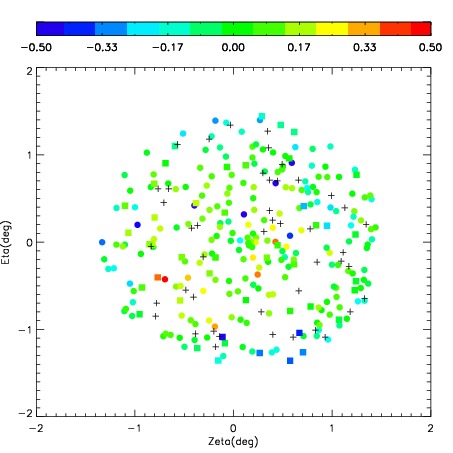
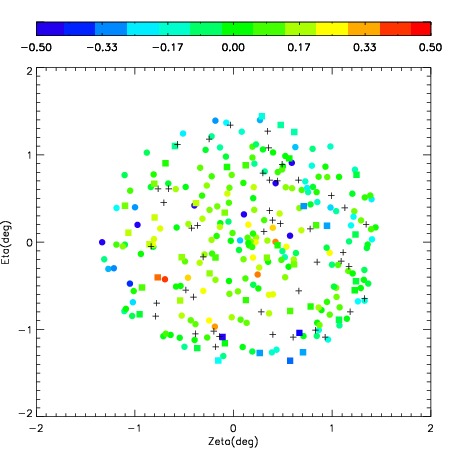
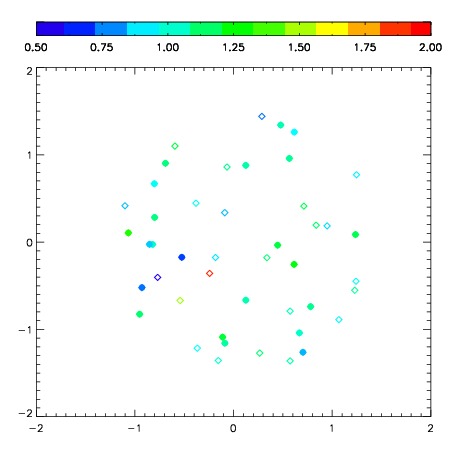
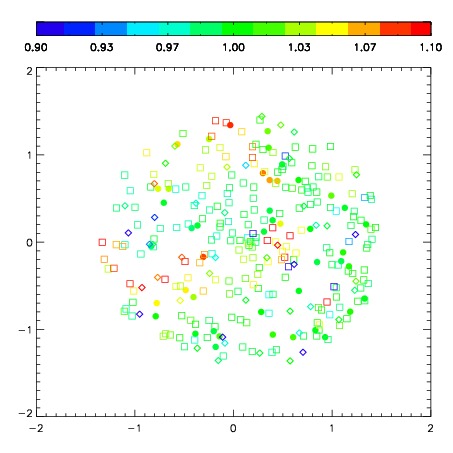
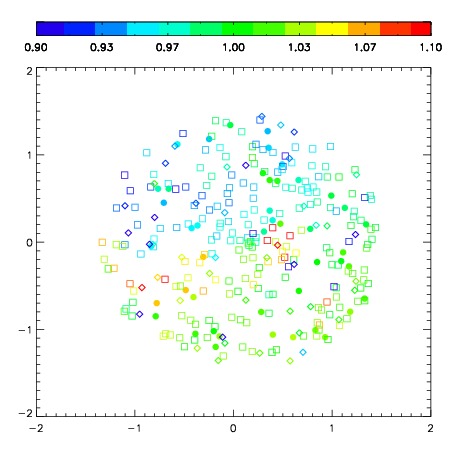
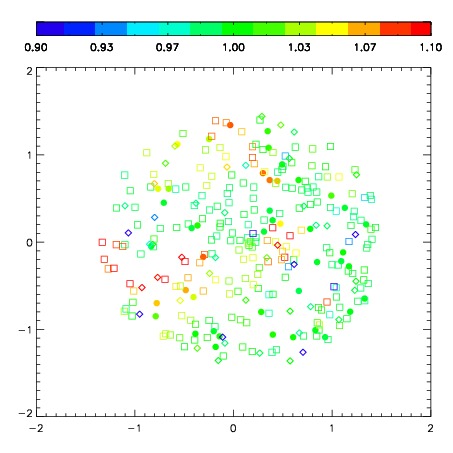
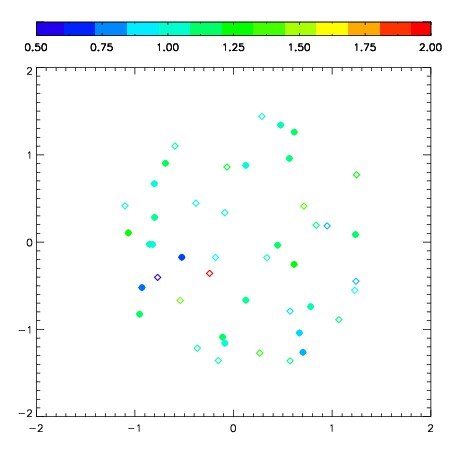
| Spatial sky telluric CO2 absorption deviations (filled: H < 10)
|
| 1700050
| 50
| | Red | Green | Blue
| | z | | 18.45
| | znorm | | 14.20
| | sky | 14.3 | 14.1 | 14.0
| | S/N | 9.9 | 16.2 | 18.6
| | S/N(c) | 9.0 | 14.8 | 17.7
| | SN(E/C) 0.68
|
| 
| 
| 
| 
| 
|
| 1700051
| 50
| | Red | Green | Blue
| | z | | 18.54
| | znorm | | 14.29
| | sky | 14.1 | 13.8 | 14.2
| | S/N | 10.7 | 17.0 | 19.9
| | S/N(c) | 9.6 | 16.5 | 19.1
| | SN(E/C) 0.64
|
| 
| 
| 
| 
| 
|
| 1700052
| 50
| | Red | Green | Blue
| | z | | 18.71
| | znorm | | 14.46
| | sky | 14.1 | 13.9 | 14.2
| | S/N | 11.9 | 19.2 | 21.9
| | S/N(c) | 10.8 | 17.6 | 21.4
| | SN(E/C) 0.62
|
| 
| 
| 
| 
| 
|
| 1700053
| 50
| | Red | Green | Blue
| | z | | 18.83
| | znorm | | 14.58
| | sky | 14.0 | 13.9 | 14.2
| | S/N | 12.9 | 20.9 | 23.7
| | S/N(c) | 11.7 | 19.7 | 22.5
| | SN(E/C) 0.59
|
| 
| 
| 
| 
| 
|
| 1700054
| 50
| | Red | Green | Blue
| | z | | 18.73
| | znorm | | 14.48
| | sky | 14.1 | 14.0 | 14.2
| | S/N | 11.9 | 19.9 | 21.8
| | S/N(c) | 10.9 | 18.6 | 21.3
| | SN(E/C) 0.62
|
| 
| 
| 
| 
| 
|
| 1700055
| 50
| | Red | Green | Blue
| | z | | 18.72
| | znorm | | 14.48
| | sky | 14.3 | 14.0 | 14.0
| | S/N | 12.2 | 19.8 | 21.7
| | S/N(c) | 10.8 | 18.3 | 20.8
| | SN(E/C) 0.63
|
| 
| 
| 
| 
| 
|
| 1700056
| 50
| | Red | Green | Blue
| | z | | 18.45
| | znorm | | 14.20
| | sky | 13.6 | 13.4 | 13.3
| | S/N | 9.7 | 15.8 | 17.6
| | S/N(c) | 8.8 | 14.6 | 17.1
| | SN(E/C) 0.67
|
| 
| 
| 
| 
| 
|