| Frame | Nreads | Zeropoints | Mag plots
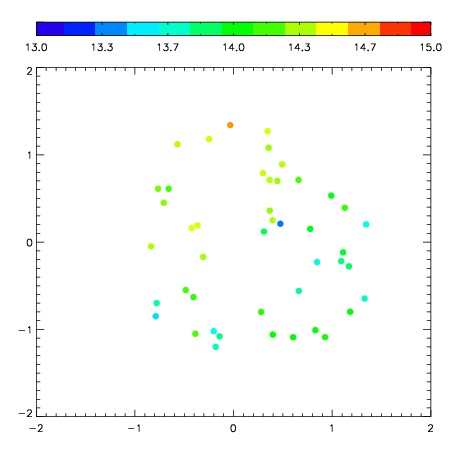
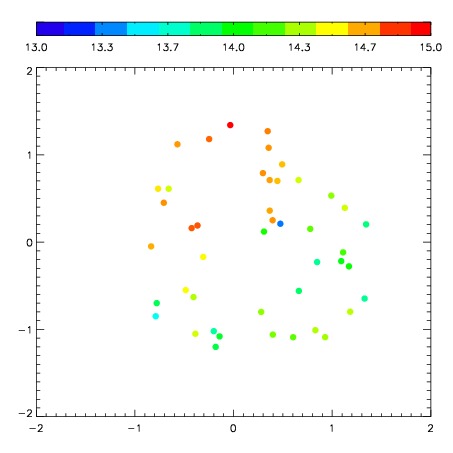
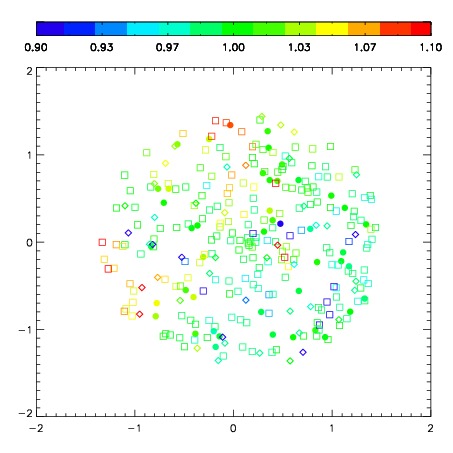
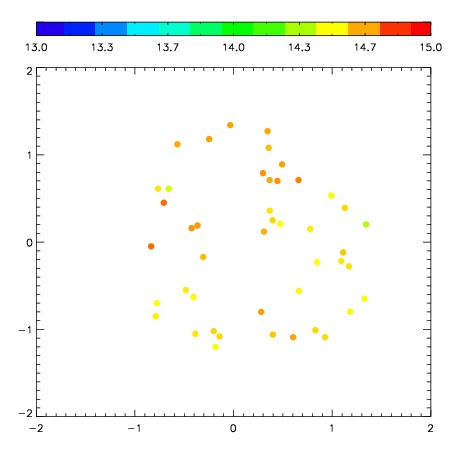
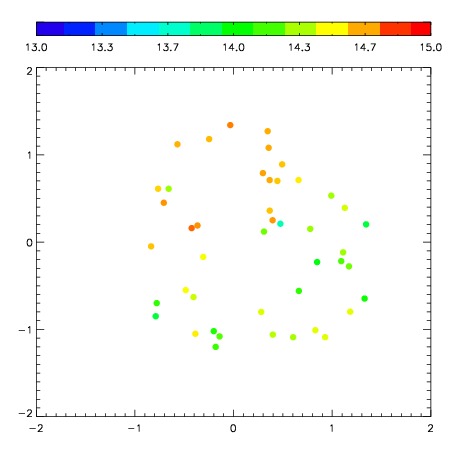
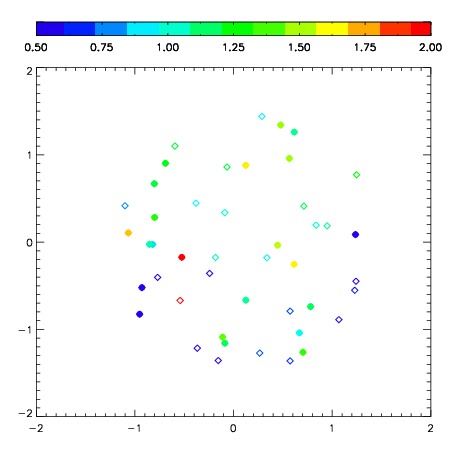
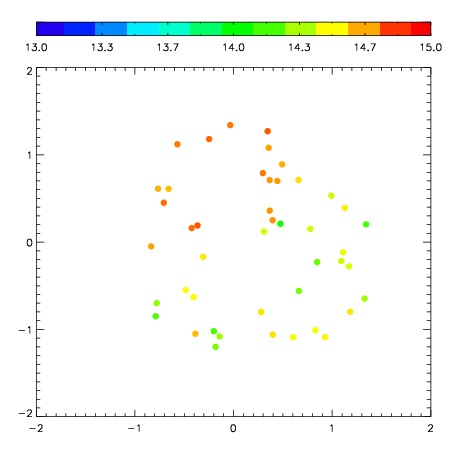
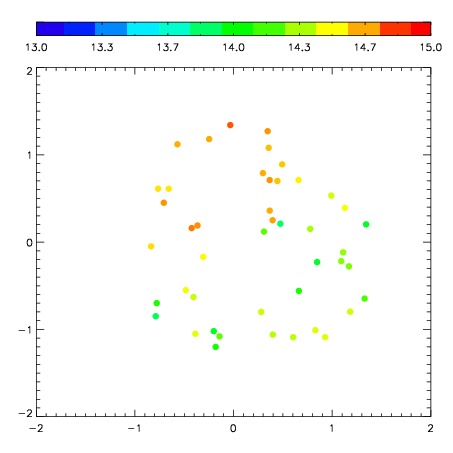
| Spatial mag deviation
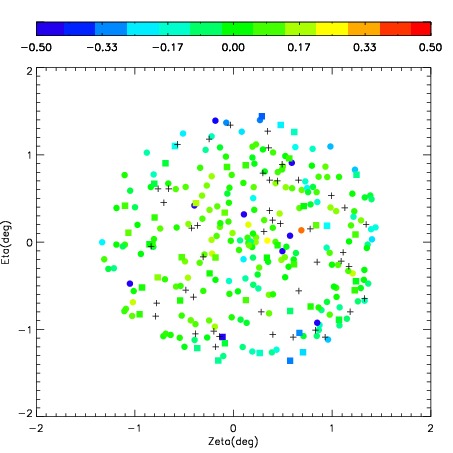
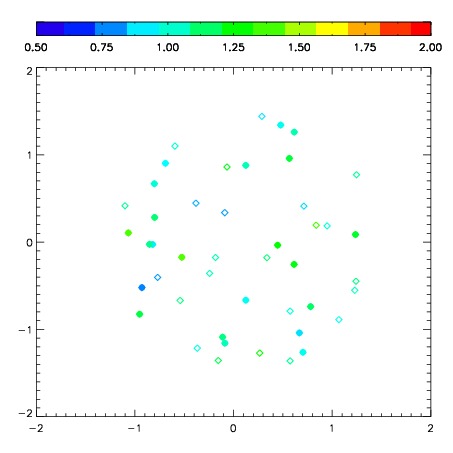
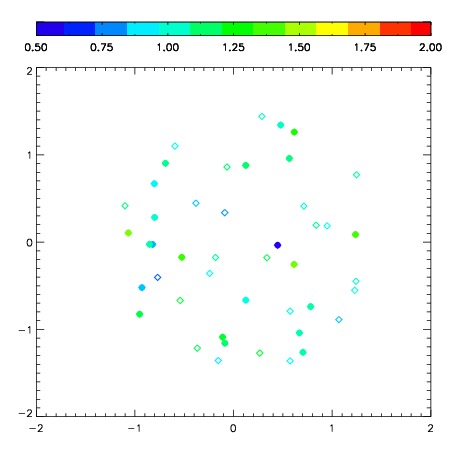
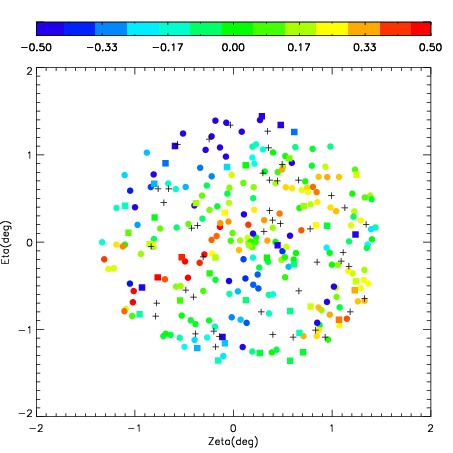
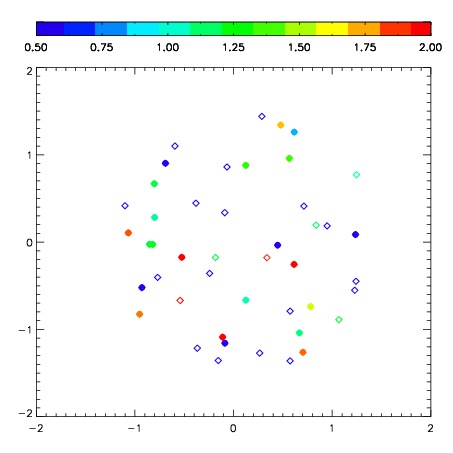
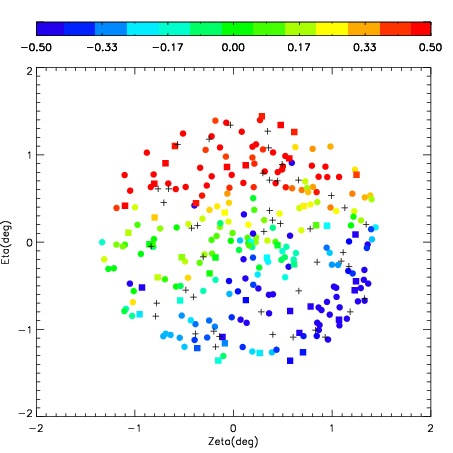
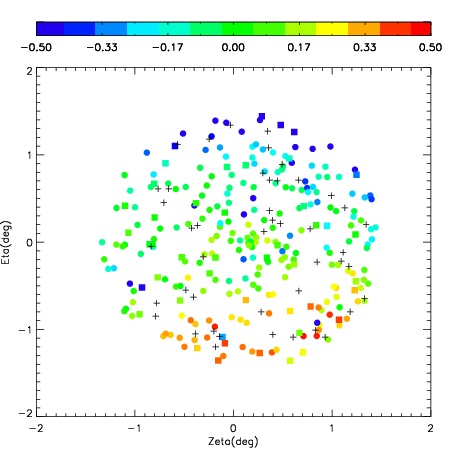
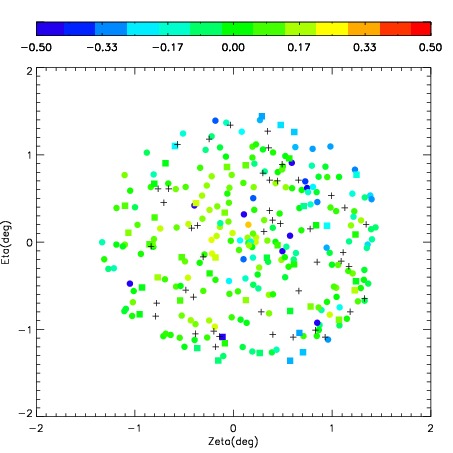
| Spatial sky 16325A emission deviations (filled: sky, open: star)
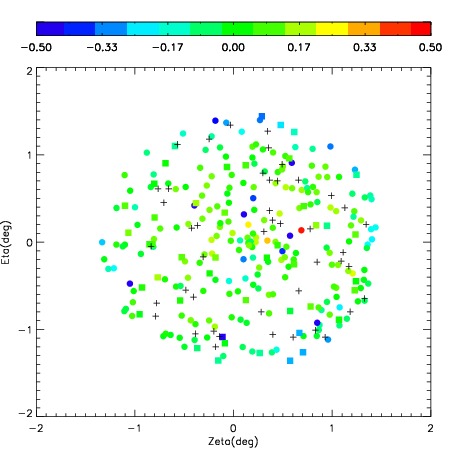
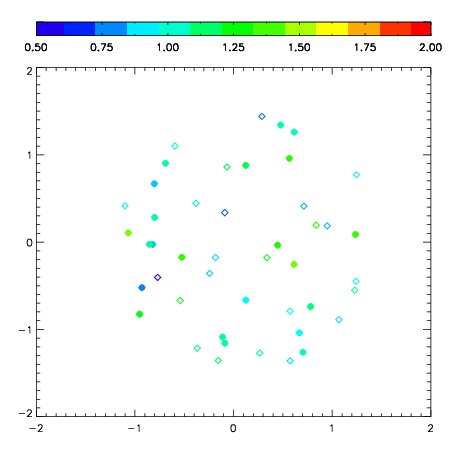
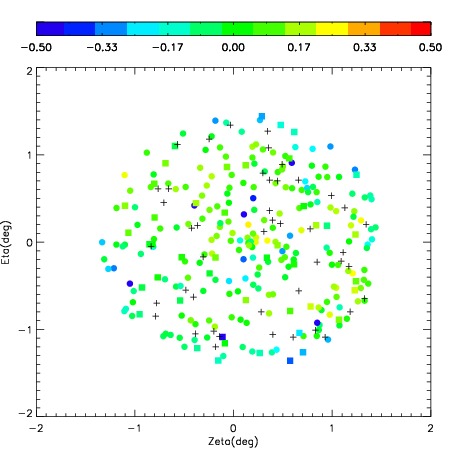
| Spatial sky continuum emission
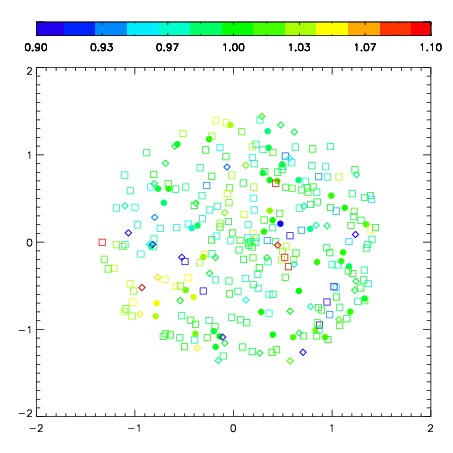
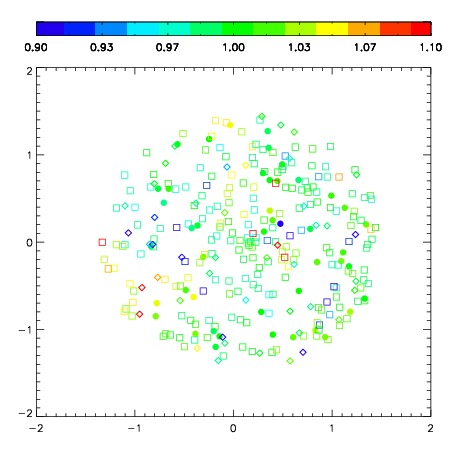
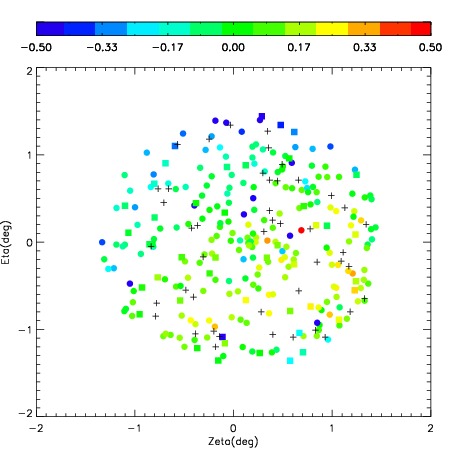
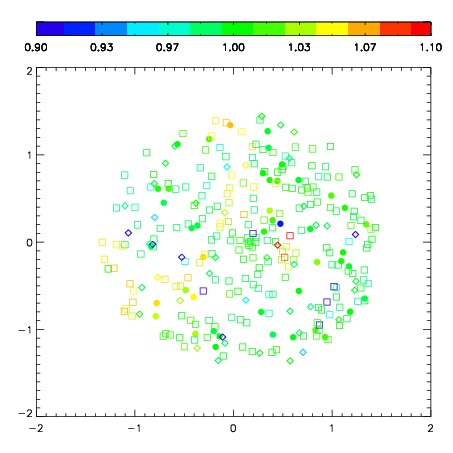
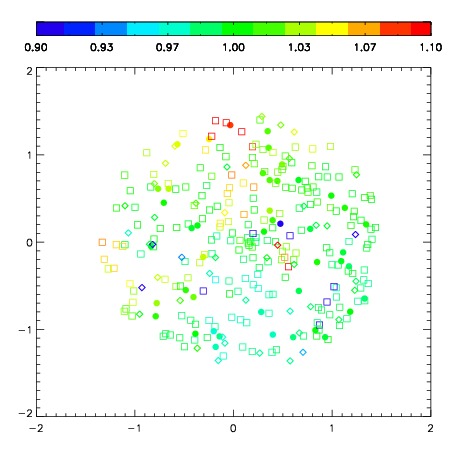
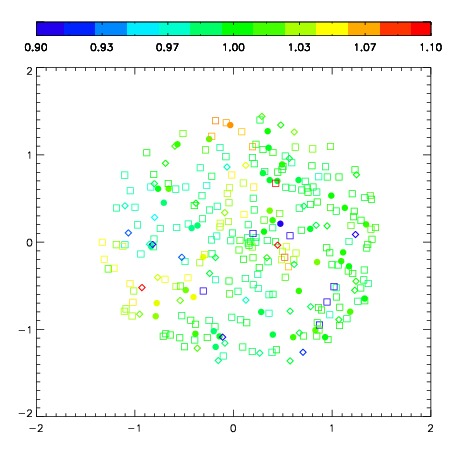
| Spatial sky telluric CO2 absorption deviations (filled: H < 10)
|
| 2420042
| 47
| | Red | Green | Blue
| | z | | 18.95
| | znorm | | 14.77
| | sky | 14.2 | 14.0 | 14.1
| | S/N | 14.0 | 23.9 | 25.5
| | S/N(c) | 12.9 | 23.0 | 24.8
| | SN(E/C) 0.50
|
| 
| 
| 
| 
| 
|
| 2420043
| 47
| | Red | Green | Blue
| | z | | 19.04
| | znorm | | 14.86
| | sky | 14.3 | 14.3 | 14.5
| | S/N | 14.7 | 25.1 | 27.2
| | S/N(c) | 12.9 | 23.8 | 26.1
| | SN(E/C) 0.48
|
| 
| 
| 
| 
| 
|
| 2420044
| 47
| | Red | Green | Blue
| | z | | 18.91
| | znorm | | 14.73
| | sky | 14.3 | 14.3 | 14.5
| | S/N | 13.5 | 23.0 | 24.5
| | S/N(c) | 11.9 | 21.3 | 23.9
| | SN(E/C) 0.49
|
| 
| 
| 
| 
| 
|
| 2420045
| 47
| | Red | Green | Blue
| | z | | 15.91
| | znorm | | 11.73
| | sky | 14.4 | 14.5 | 15.2
| | S/N | 1.1 | 3.1 | 3.1
| | S/N(c) | 1.1 | 3.0 | 2.9
| | SN(E/C) 0.97
|
| 
| 
| 
| 
| 
|
| 2420046
| 47
| | Red | Green | Blue
| | z | | 18.47
| | znorm | | 14.29
| | sky | 14.4 | 14.4 | 14.7
| | S/N | 10.0 | 18.1 | 19.4
| | S/N(c) | 8.5 | 17.0 | 18.5
| | SN(E/C) 0.62
|
| 
| 
| 
| 
| 
|
| 2420047
| 47
| | Red | Green | Blue
| | z | | 17.01
| | znorm | | 12.83
| | sky | 14.5 | 14.5 | 14.9
| | S/N | 3.4 | 7.4 | 8.9
| | S/N(c) | 3.0 | 7.0 | 8.2
| | SN(E/C) 0.93
|
| 
| 
| 
| 
| 
|
| 2420048
| 47
| | Red | Green | Blue
| | z | | 17.95
| | znorm | | 13.77
| | sky | 14.4 | 14.5 | 14.7
| | S/N | 6.5 | 13.2 | 14.4
| | S/N(c) | 6.0 | 12.2 | 13.3
| | SN(E/C) 0.73
|
| 
| 
| 
| 
| 
|
| 2420049
| 47
| | Red | Green | Blue
| | z | | 18.59
| | znorm | | 14.41
| | sky | 14.2 | 14.4 | 14.5
| | S/N | 10.8 | 19.5 | 21.0
| | S/N(c) | 9.8 | 18.5 | 20.0
| | SN(E/C) 0.58
|
| 
| 
| 
| 
| 
|