| Frame | Nreads | Zeropoints | Mag plots
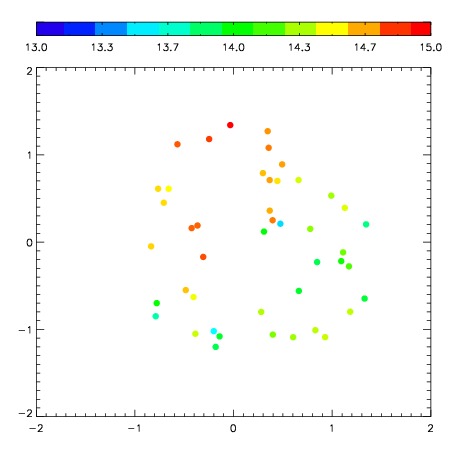
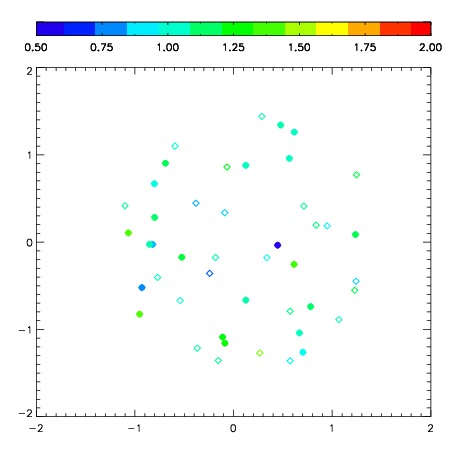
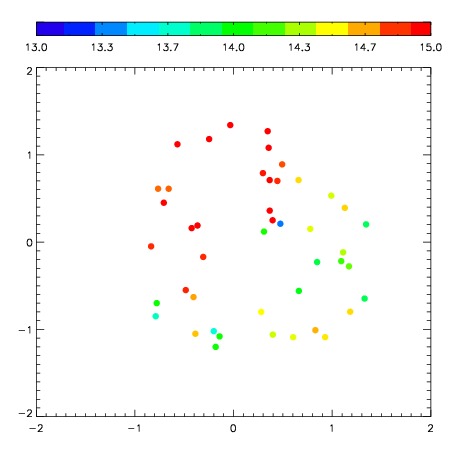
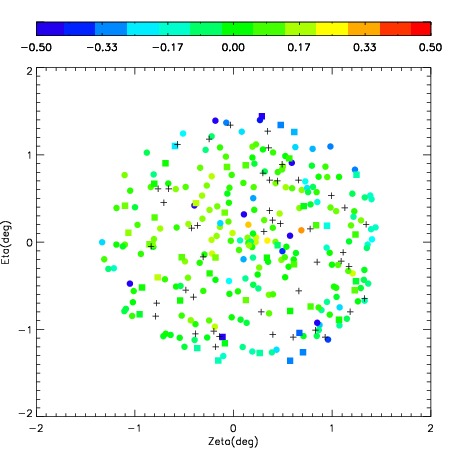
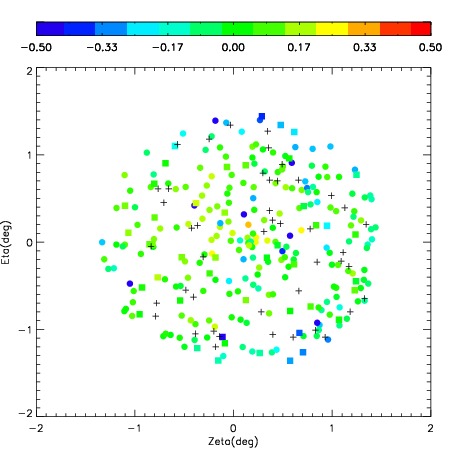
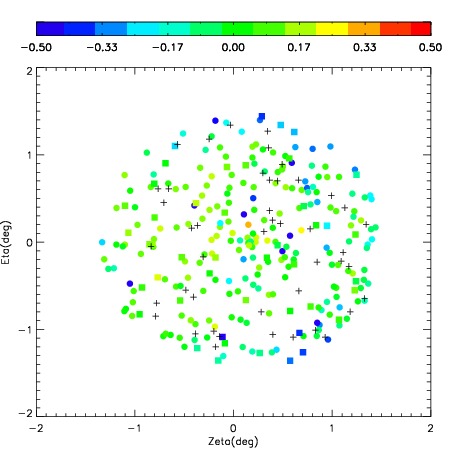
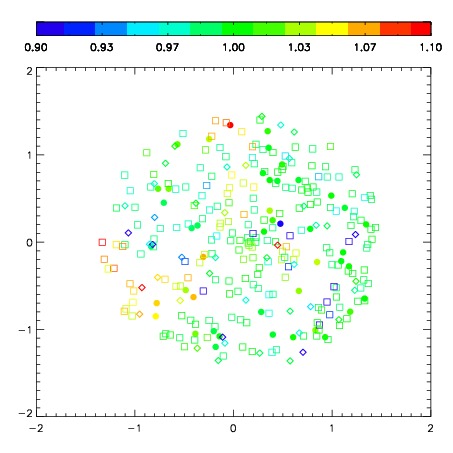
| Spatial mag deviation
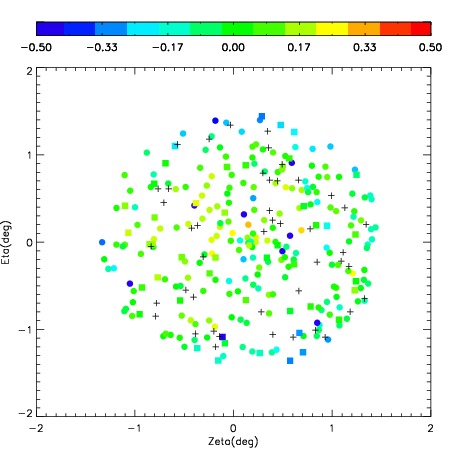
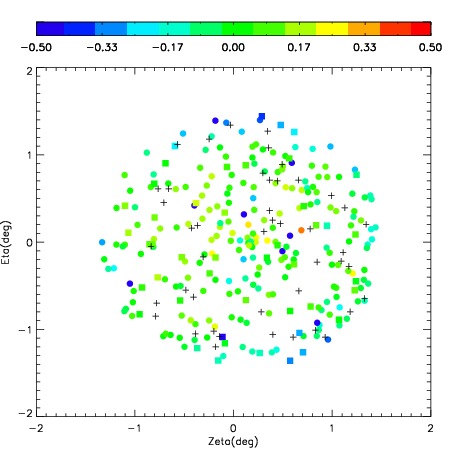
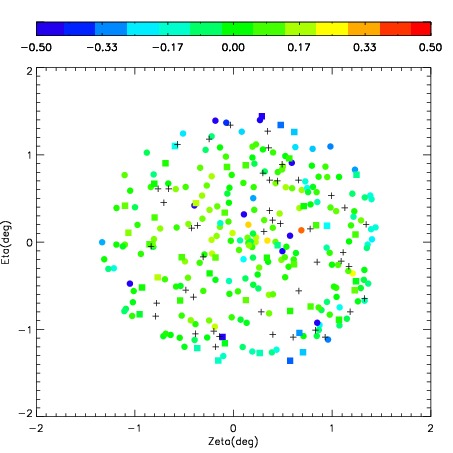
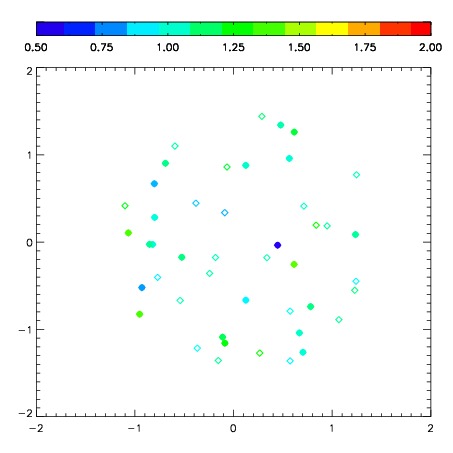
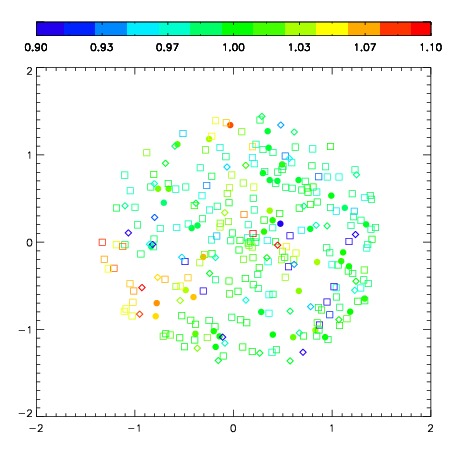
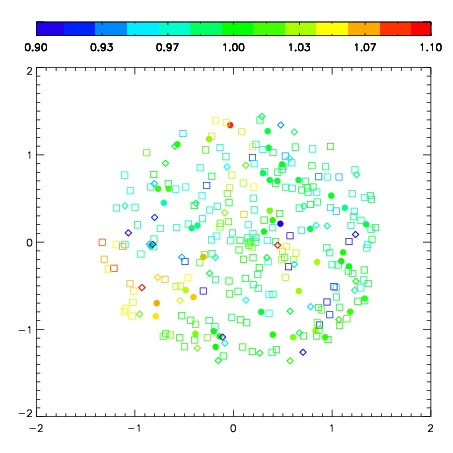
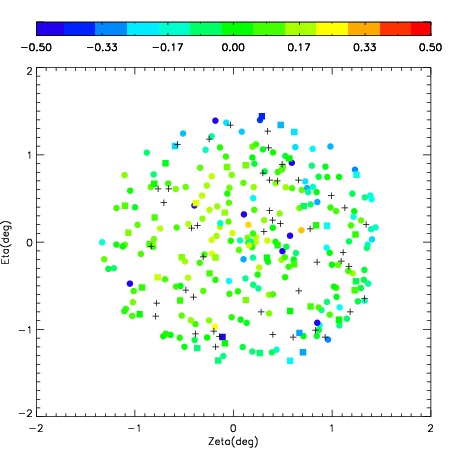
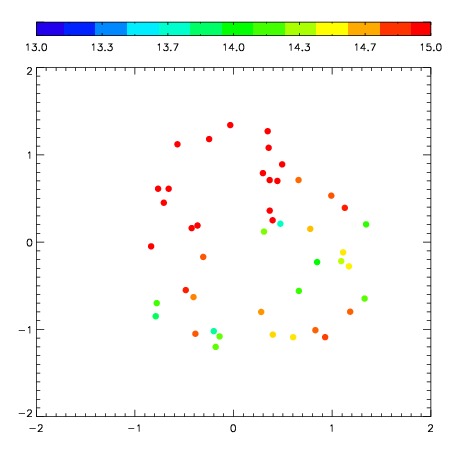
| Spatial sky 16325A emission deviations (filled: sky, open: star)
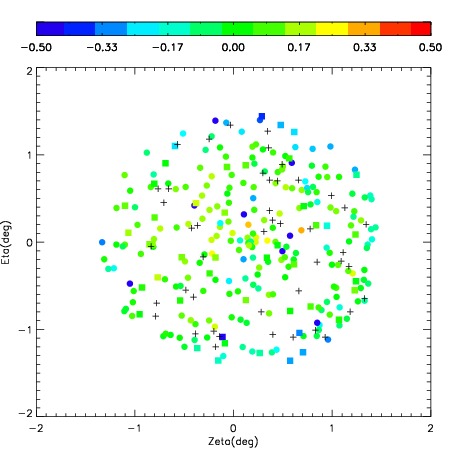
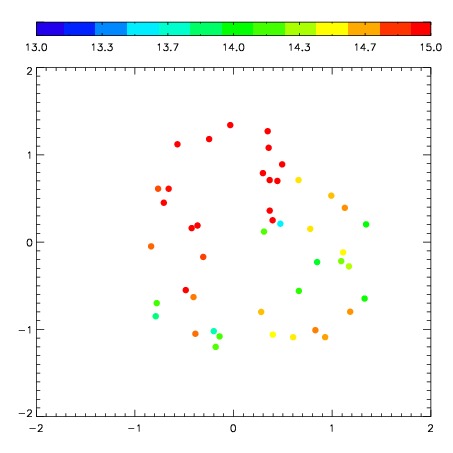
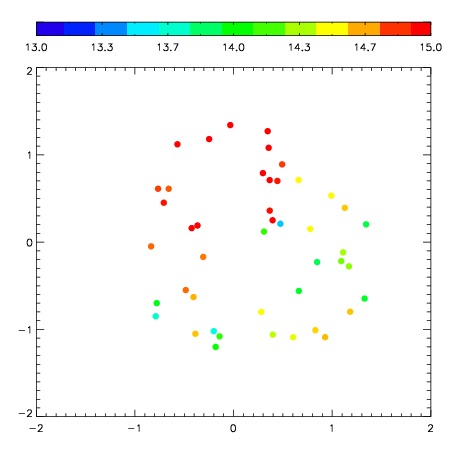
| Spatial sky continuum emission
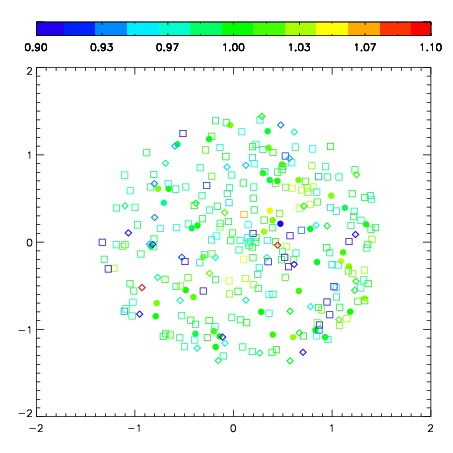
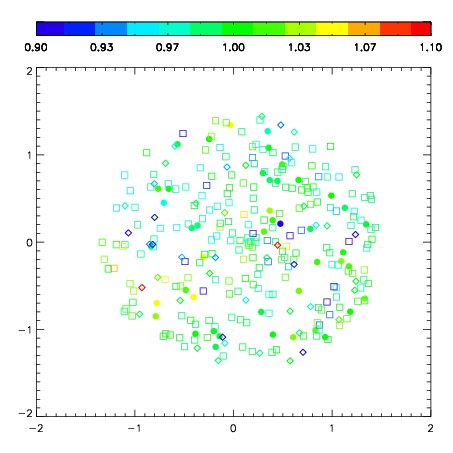
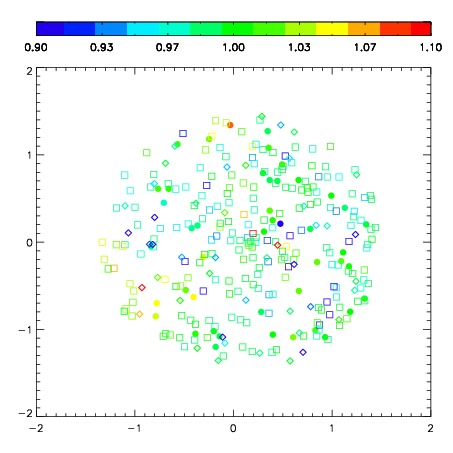
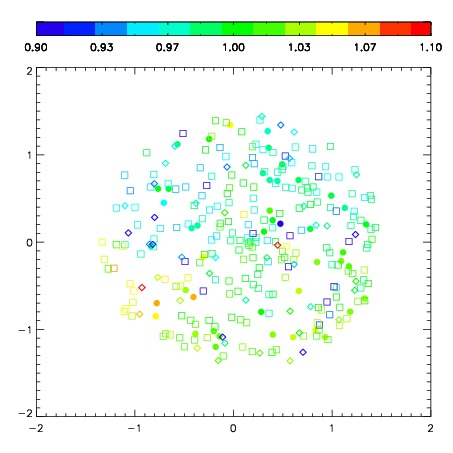
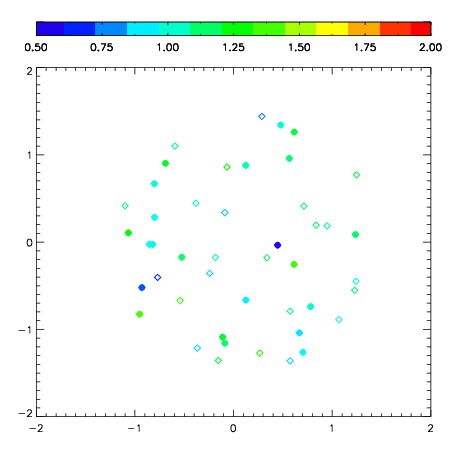
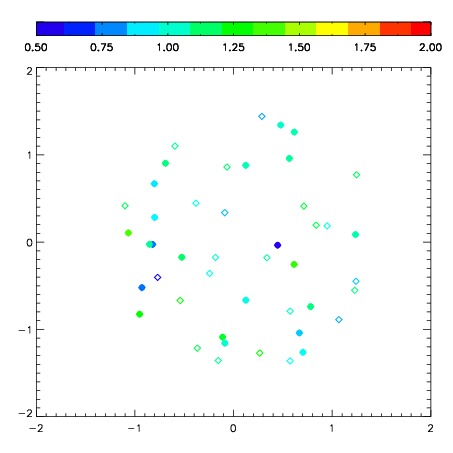
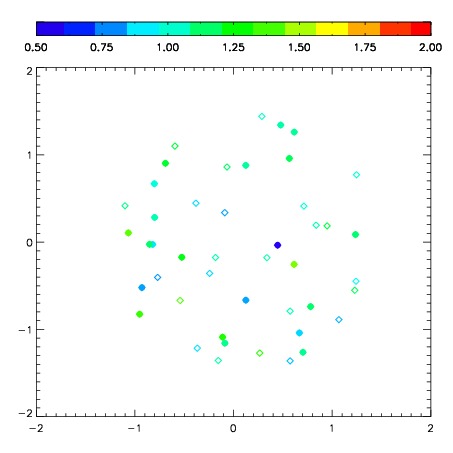
| Spatial sky telluric CO2 absorption deviations (filled: H < 10)
|
| 2590011
| 47
| | Red | Green | Blue
| | z | | 19.03
| | znorm | | 14.85
| | sky | 14.5 | 14.3 | 14.2
| | S/N | 15.5 | 25.9 | 27.4
| | S/N(c) | 14.2 | 24.8 | 26.8
| | SN(E/C) 0.49
|
| 
| 
| 
| 
| 
|
| 2590012
| 47
| | Red | Green | Blue
| | z | | 18.99
| | znorm | | 14.81
| | sky | 14.7 | 14.5 | 14.6
| | S/N | 14.9 | 25.1 | 27.1
| | S/N(c) | 13.2 | 23.8 | 25.8
| | SN(E/C) 0.50
|
| 
| 
| 
| 
| 
|
| 2590013
| 47
| | Red | Green | Blue
| | z | | 19.19
| | znorm | | 15.01
| | sky | 14.8 | 14.5 | 14.6
| | S/N | 16.5 | 27.7 | 30.0
| | S/N(c) | 15.1 | 26.3 | 29.0
| | SN(E/C) 0.48
|
| 
| 
| 
| 
| 
|
| 2590014
| 47
| | Red | Green | Blue
| | z | | 19.07
| | znorm | | 14.89
| | sky | 14.5 | 14.5 | 14.6
| | S/N | 15.5 | 26.2 | 28.1
| | S/N(c) | 13.5 | 25.3 | 27.1
| | SN(E/C) 0.50
|
| 
| 
| 
| 
| 
|
| 2590015
| 47
| | Red | Green | Blue
| | z | | 19.13
| | znorm | | 14.95
| | sky | 14.7 | 14.5 | 14.6
| | S/N | 16.4 | 26.7 | 29.0
| | S/N(c) | 14.5 | 25.8 | 27.8
| | SN(E/C) 0.51
|
| 
| 
| 
| 
| 
|
| 2590016
| 47
| | Red | Green | Blue
| | z | | 19.06
| | znorm | | 14.88
| | sky | 14.5 | 14.6 | 14.6
| | S/N | 15.5 | 26.2 | 27.8
| | S/N(c) | 13.7 | 25.0 | 26.6
| | SN(E/C) 0.52
|
| 
| 
| 
| 
| 
|
| 2590017
| 47
| | Red | Green | Blue
| | z | | 19.18
| | znorm | | 15.00
| | sky | 14.7 | 14.5 | 14.5
| | S/N | 17.1 | 28.1 | 30.3
| | S/N(c) | 15.1 | 26.6 | 29.1
| | SN(E/C) 0.47
|
| 
| 
| 
| 
| 
|
| 2590018
| 47
| | Red | Green | Blue
| | z | | 19.00
| | znorm | | 14.82
| | sky | 14.5 | 14.7 | 14.6
| | S/N | 15.0 | 24.9 | 26.9
| | S/N(c) | 13.3 | 23.8 | 25.8
| | SN(E/C) 0.54
|
| 
| 
| 
| 
| 
|