| Frame | Nreads | Zeropoints | Mag plots
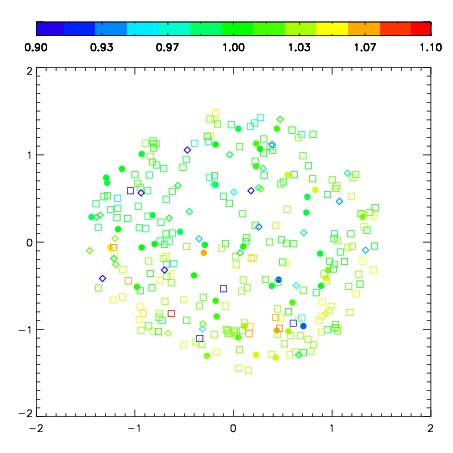
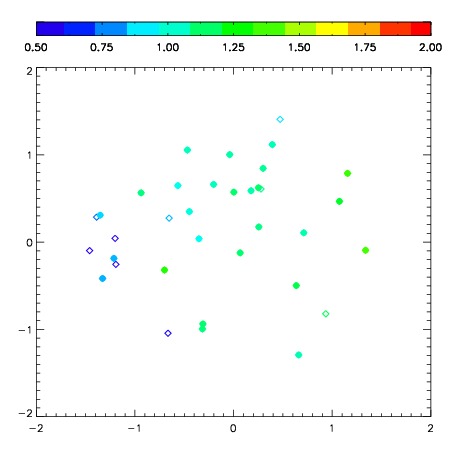
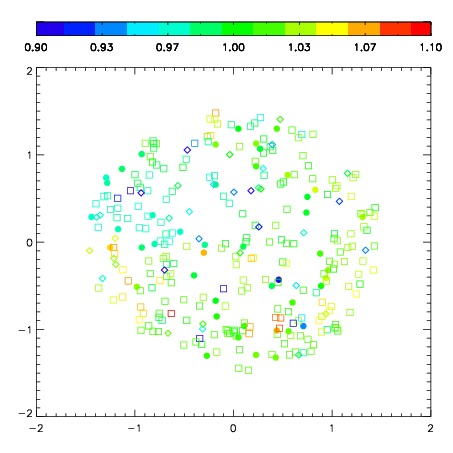
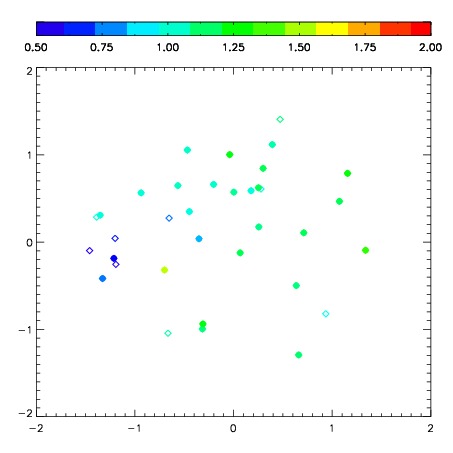
| Spatial mag deviation
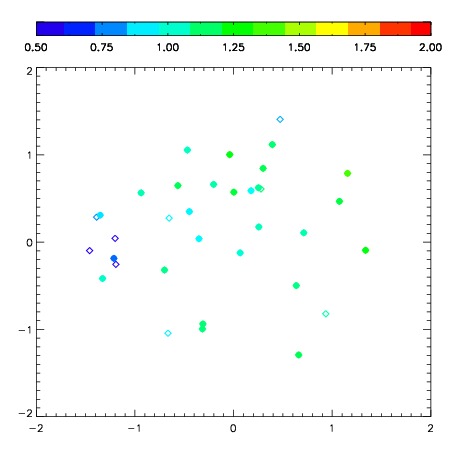
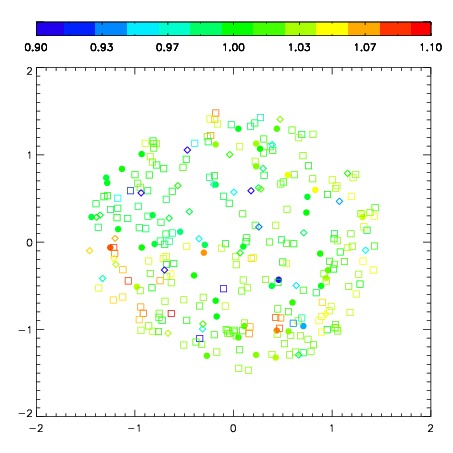
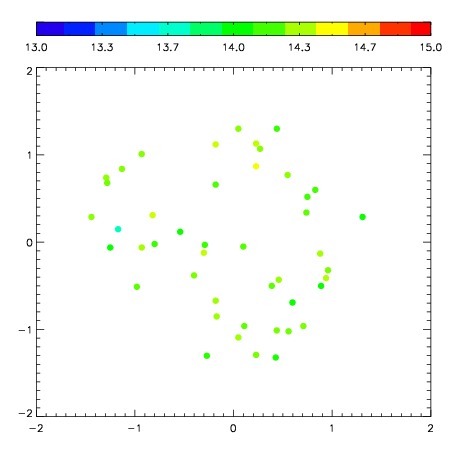
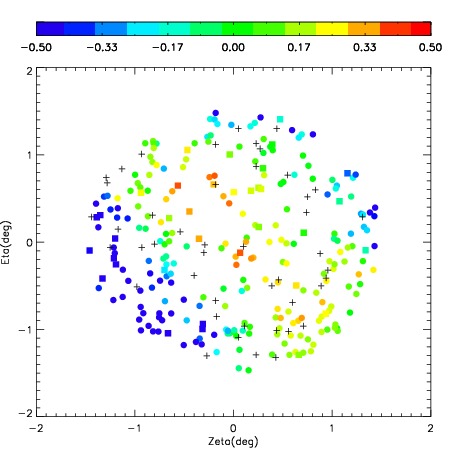
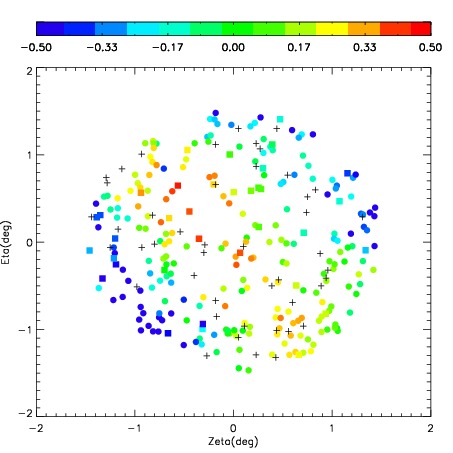
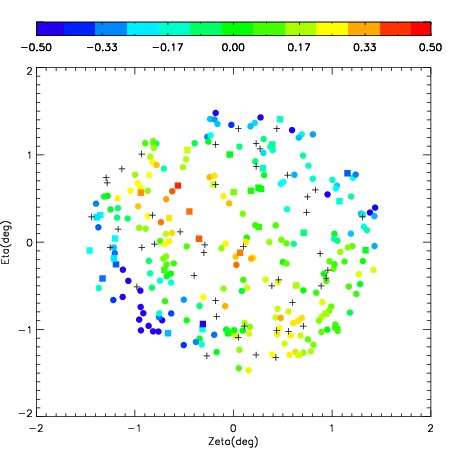
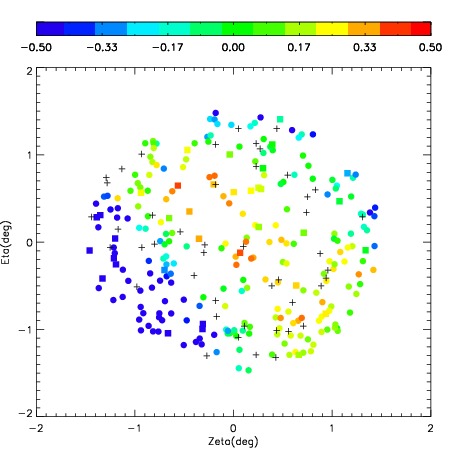
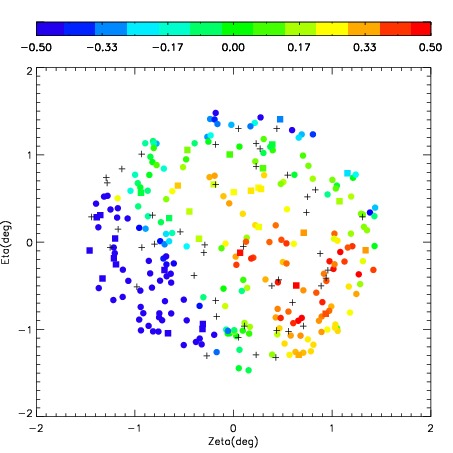
| Spatial sky 16325A emission deviations (filled: sky, open: star)
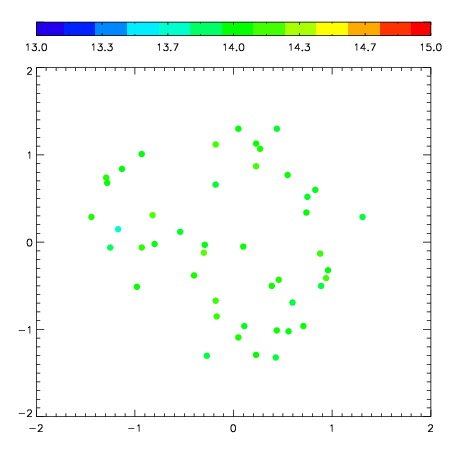
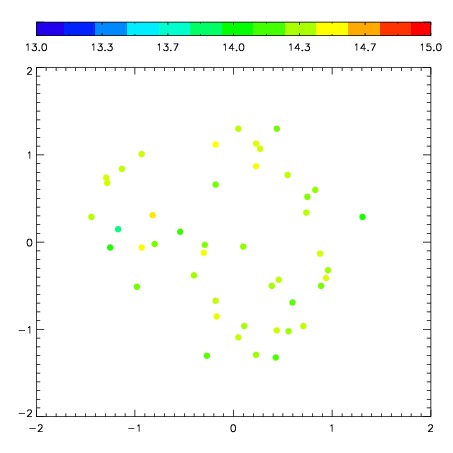
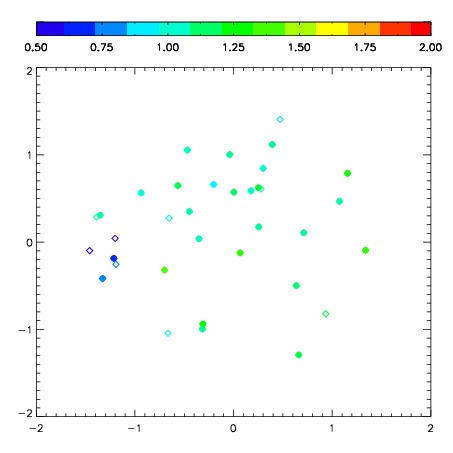
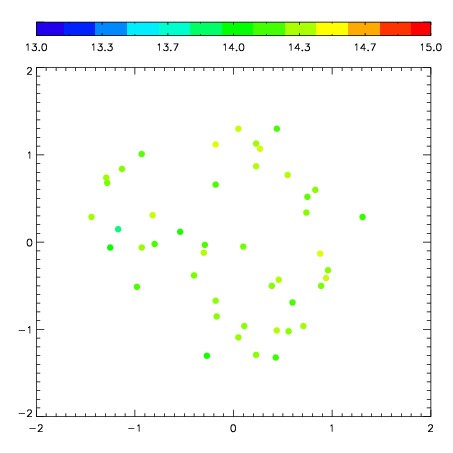
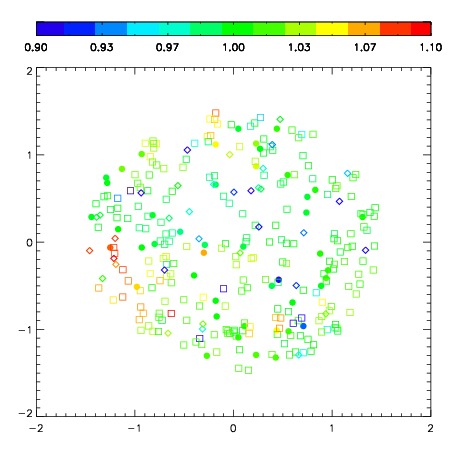
| Spatial sky continuum emission
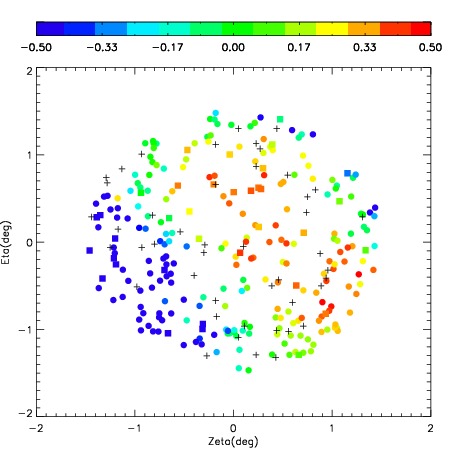
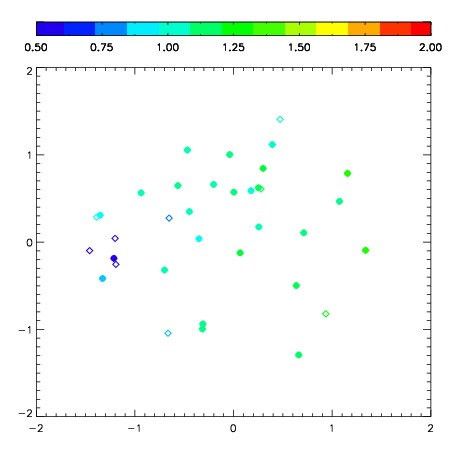
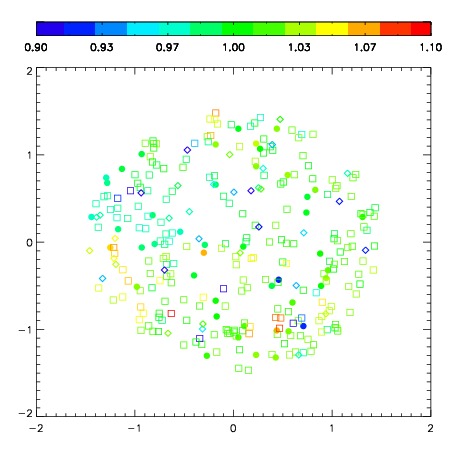
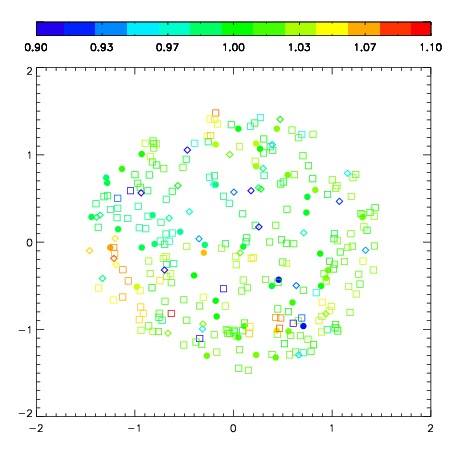
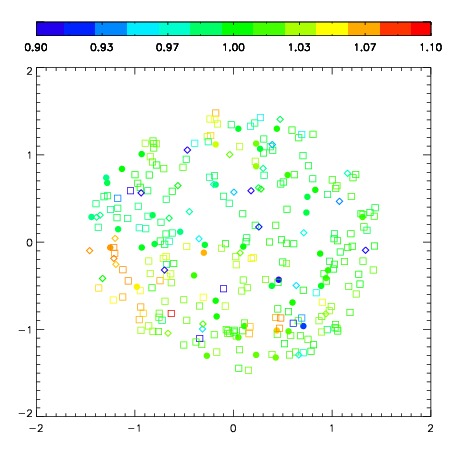
| Spatial sky telluric CO2 absorption deviations (filled: H < 10)
|
| 2560013
| 47
| | Red | Green | Blue
| | z | | 18.66
| | znorm | | 14.48
| | sky | 14.0 | 14.0 | 13.8
| | S/N | 9.9 | 16.8 | 19.0
| | S/N(c) | 8.6 | 15.6 | 18.2
| | SN(E/C) 0.83
|
| 
| 
| 
| 
| 
|
| 2560014
| 47
| | Red | Green | Blue
| | z | | 18.39
| | znorm | | 14.21
| | sky | 14.2 | 14.0 | 14.0
| | S/N | 8.2 | 15.0 | 16.0
| | S/N(c) | 7.1 | 13.9 | 15.3
| | SN(E/C) 0.89
|
| 
| 
| 
| 
| 
|
| 2560015
| 47
| | Red | Green | Blue
| | z | | 18.66
| | znorm | | 14.48
| | sky | 14.2 | 14.2 | 14.2
| | S/N | 10.3 | 17.7 | 19.2
| | S/N(c) | 9.1 | 16.3 | 18.0
| | SN(E/C) 0.84
|
| 
| 
| 
| 
| 
|
| 2560016
| 47
| | Red | Green | Blue
| | z | | 18.76
| | znorm | | 14.58
| | sky | 14.2 | 14.3 | 14.2
| | S/N | 11.5 | 17.5 | 21.3
| | S/N(c) | 10.6 | 16.1 | 20.3
| | SN(E/C) 0.84
|
| 
| 
| 
| 
| 
|
| 2560017
| 47
| | Red | Green | Blue
| | z | | 18.81
| | znorm | | 14.63
| | sky | 14.4 | 14.3 | 14.3
| | S/N | 13.8 | 20.6 | 24.0
| | S/N(c) | 12.4 | 19.2 | 22.1
| | SN(E/C) 0.76
|
| 
| 
| 
| 
| 
|
| 2560018
| 47
| | Red | Green | Blue
| | z | | 18.57
| | znorm | | 14.39
| | sky | 14.3 | 14.2 | 14.2
| | S/N | 12.2 | 18.8 | 21.2
| | S/N(c) | 11.0 | 17.0 | 19.6
| | SN(E/C) 0.79
|
| 
| 
| 
| 
| 
|
| 2560019
| 47
| | Red | Green | Blue
| | z | | 18.83
| | znorm | | 14.65
| | sky | 14.2 | 14.2 | 14.1
| | S/N | 11.5 | 18.5 | 21.4
| | S/N(c) | 10.4 | 17.1 | 19.8
| | SN(E/C) 0.84
|
| 
| 
| 
| 
| 
|
| 2560020
| 47
| | Red | Green | Blue
| | z | | 18.33
| | znorm | | 14.15
| | sky | 14.0 | 14.0 | 13.9
| | S/N | 8.4 | 14.9 | 15.3
| | S/N(c) | 7.6 | 14.3 | 14.1
| | SN(E/C) 0.85
|
| 
| 
| 
| 
| 
|