| Frame | Nreads | Zeropoints | Mag plots
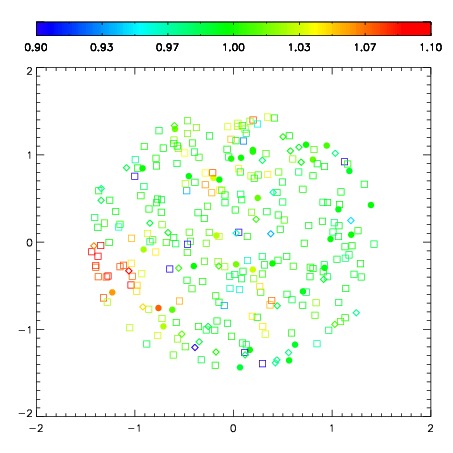
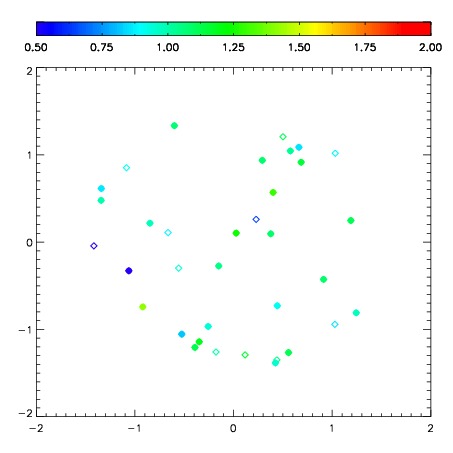
| Spatial mag deviation
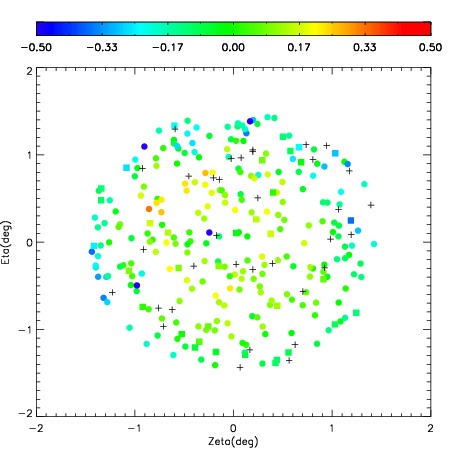
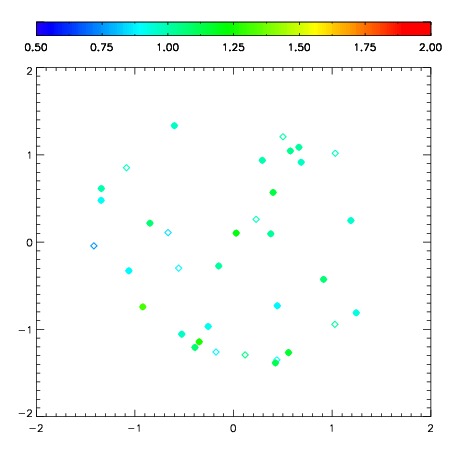
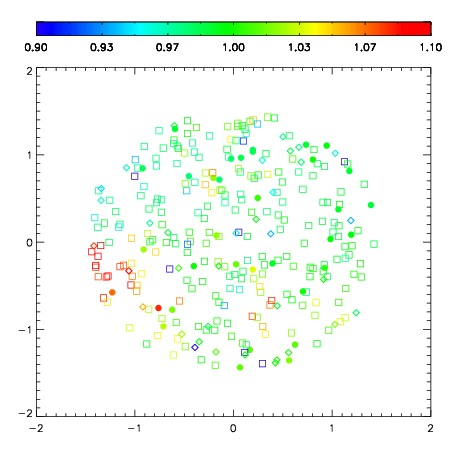
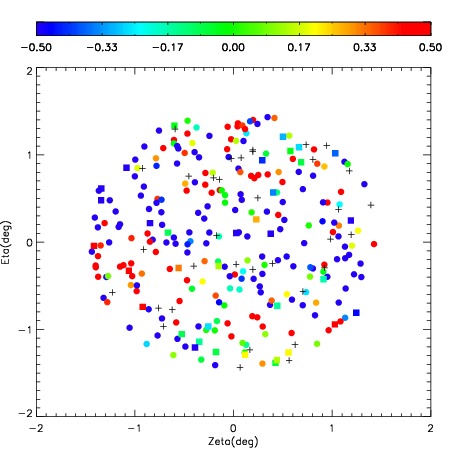
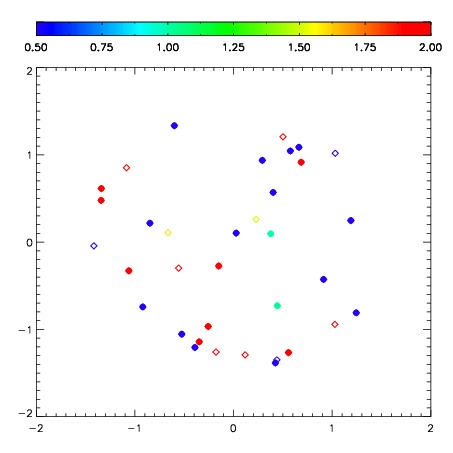
| Spatial sky 16325A emission deviations (filled: sky, open: star)
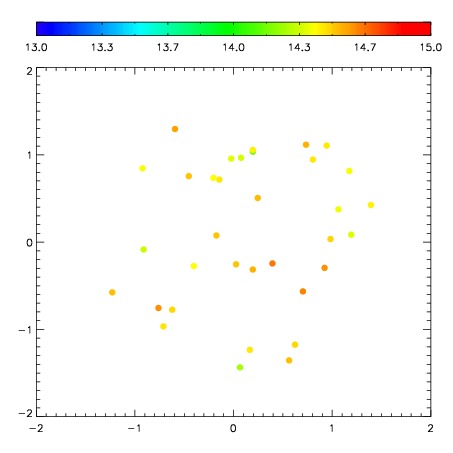
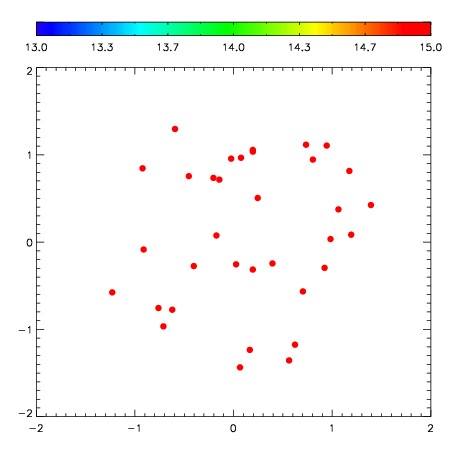
| Spatial sky continuum emission
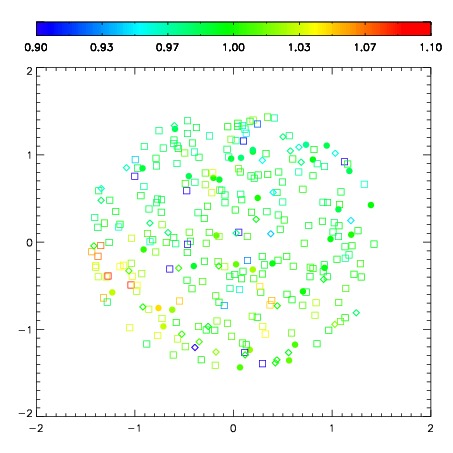
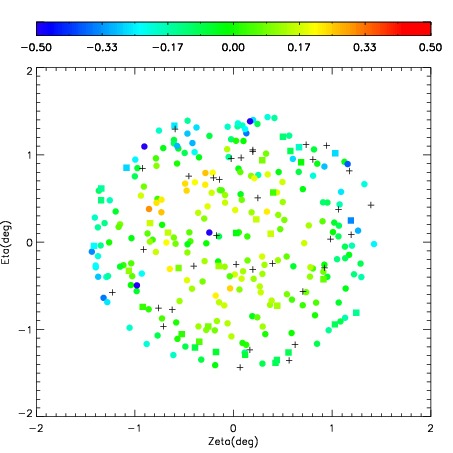
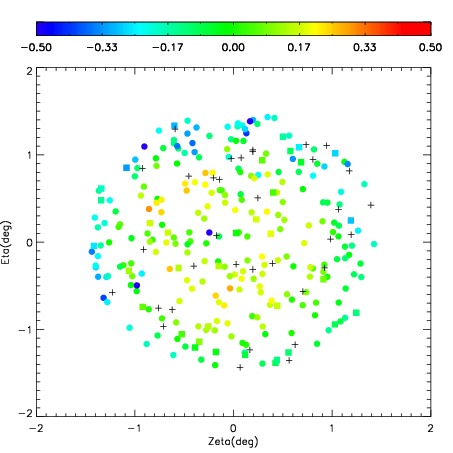
| Spatial sky telluric CO2 absorption deviations (filled: H < 10)
|
| 9960018
| 47
| | Red | Green | Blue
| | z | | 18.62
| | znorm | | 14.44
| | sky | 14.5 | 14.3 | 14.3
| | S/N | 11.8 | 19.6 | 19.9
| | S/N(c) | 10.5 | 18.1 | 18.5
| | SN(E/C) 0.95
|
| 
| 
| 
| 
| 
|
| 9960019
| 47
| | Red | Green | Blue
| | z | | 18.65
| | znorm | | 14.47
| | sky | 14.6 | 14.5 | 14.5
| | S/N | 11.8 | 19.5 | 20.3
| | S/N(c) | 10.5 | 18.0 | 18.8
| | SN(E/C) 0.92
|
| 
| 
| 
| 
| 
|
| 9960020
| 47
| | Red | Green | Blue
| | z | | 18.63
| | znorm | | 14.45
| | sky | 14.6 | 14.5 | 14.7
| | S/N | 11.3 | 19.4 | 20.1
| | S/N(c) | 9.7 | 17.7 | 18.5
| | SN(E/C) 0.93
|
| 
| 
| 
| 
| 
|
| 9960021
| 47
| | Red | Green | Blue
| | z | | 13.41
| | znorm | | 9.23
| | sky | 15.1 | 15.5 | 16.2
| | S/N | 0.1 | 0.3 | 3.5
| | S/N(c) | 0.0 | 0.0 | 0.0
| | SN(E/C) 1.39
|
| 
| 
| 
| 
| 
|