| Frame | Nreads | Zeropoints | Mag plots
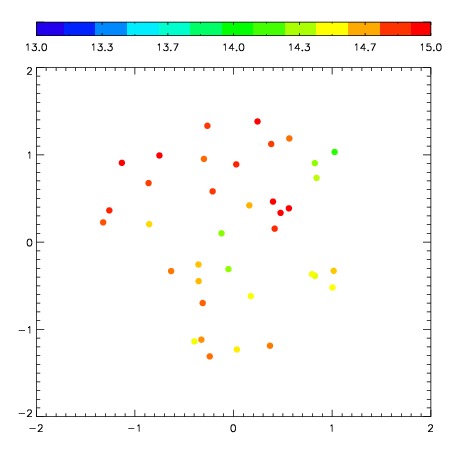
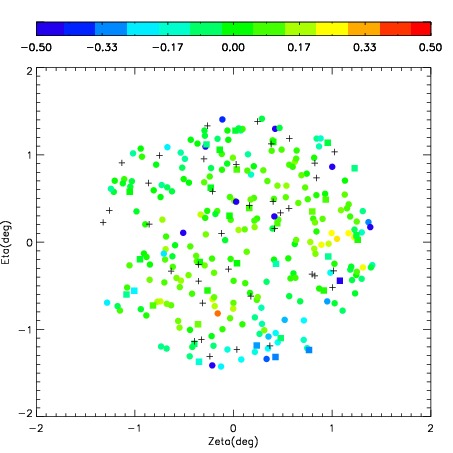
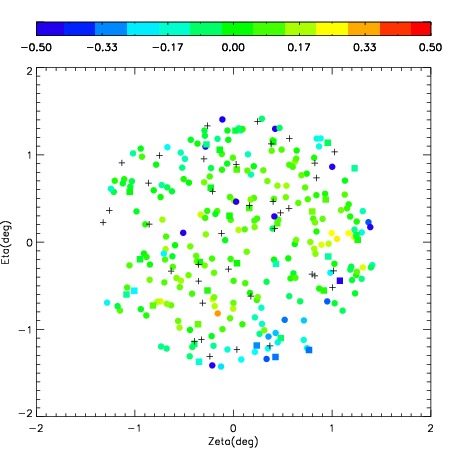
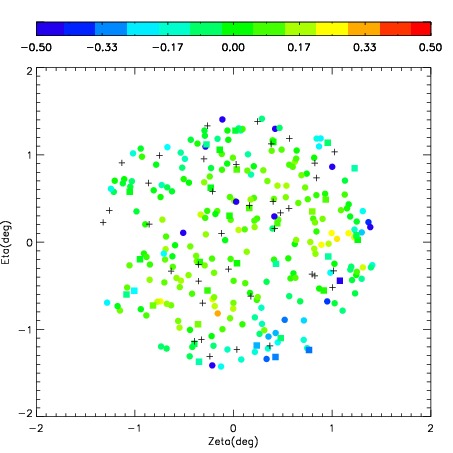
| Spatial mag deviation
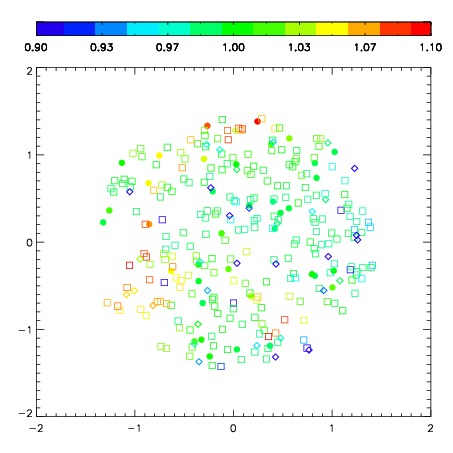
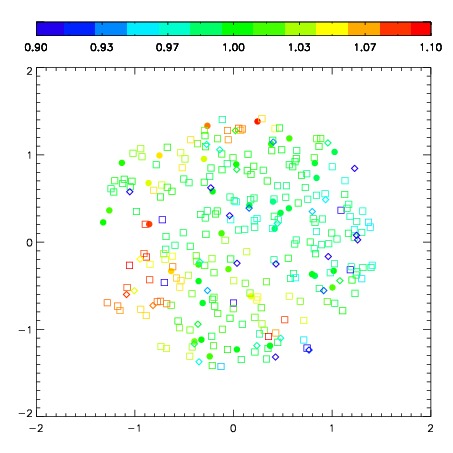
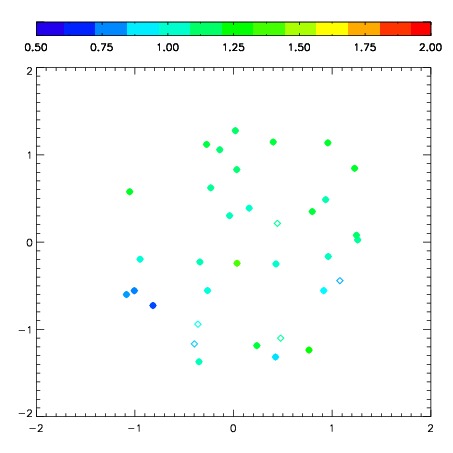
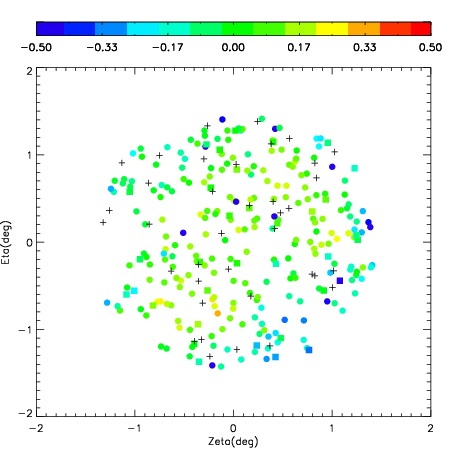
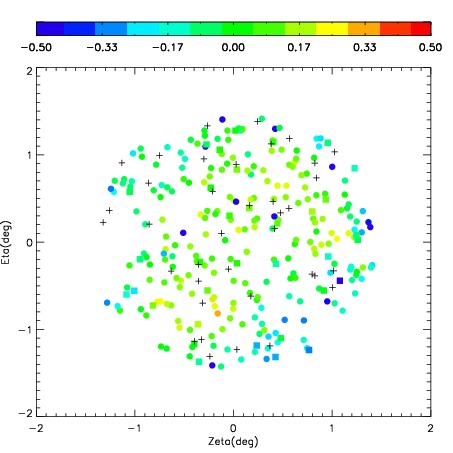
| Spatial sky 16325A emission deviations (filled: sky, open: star)
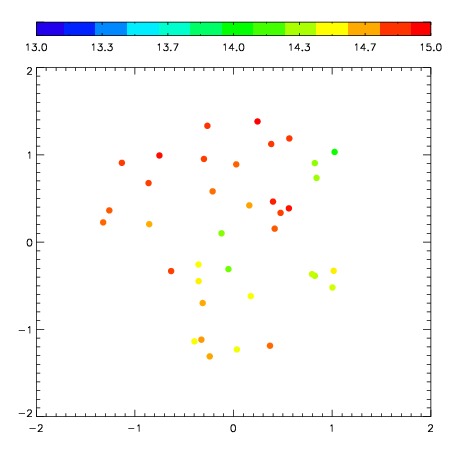
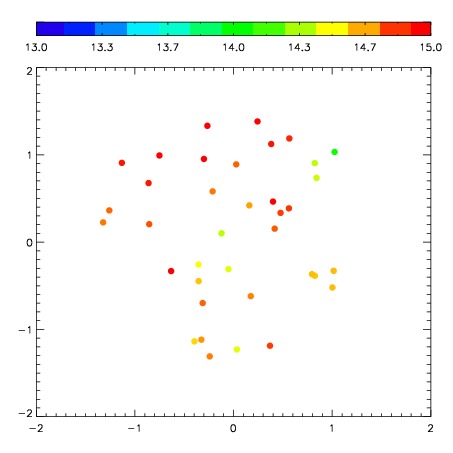
| Spatial sky continuum emission
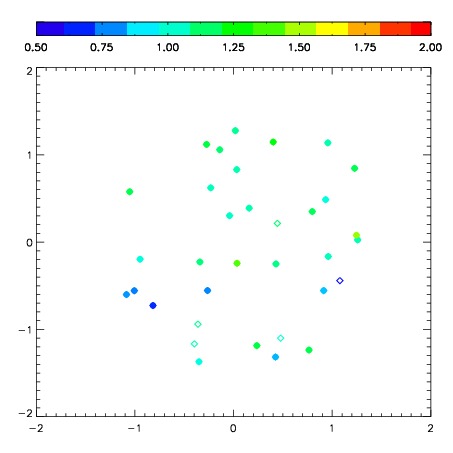
| Spatial sky telluric CO2 absorption deviations (filled: H < 10)
|
| 2860053
| 47
| | Red | Green | Blue
| | z | | 19.17
| | znorm | | 14.99
| | sky | 14.8 | 14.7 | 14.7
| | S/N | 18.6 | 29.1 | 33.0
| | S/N(c) | 16.6 | 26.4 | 31.2
| | SN(E/C) 0.79
|
| 
| 
| 
| 
| 
|
| 2860054
| 47
| | Red | Green | Blue
| | z | | 19.18
| | znorm | | 15.00
| | sky | 14.5 | 14.6 | 14.8
| | S/N | 18.6 | 29.3 | 32.9
| | S/N(c) | 16.8 | 26.9 | 31.2
| | SN(E/C) 0.80
|
| 
| 
| 
| 
| 
|
| 2860055
| 47
| | Red | Green | Blue
| | z | | 19.18
| | znorm | | 15.00
| | sky | 14.7 | 14.7 | 14.8
| | S/N | 18.5 | 29.3 | 32.7
| | S/N(c) | 16.9 | 27.0 | 30.9
| | SN(E/C) 0.75
|
| 
| 
| 
| 
| 
|
| 2860056
| 47
| | Red | Green | Blue
| | z | | 19.17
| | znorm | | 14.99
| | sky | 14.6 | 14.7 | 14.8
| | S/N | 18.4 | 29.1 | 32.8
| | S/N(c) | 16.6 | 26.7 | 31.0
| | SN(E/C) 0.81
|
| 
| 
| 
| 
| 
|
| 2860057
| 47
| | Red | Green | Blue
| | z | | 19.14
| | znorm | | 14.96
| | sky | 14.6 | 14.6 | 14.9
| | S/N | 18.4 | 29.0 | 32.2
| | S/N(c) | 16.2 | 26.9 | 30.4
| | SN(E/C) 0.84
|
| 
| 
| 
| 
| 
|
| 2860058
| 47
| | Red | Green | Blue
| | z | | 19.10
| | znorm | | 14.92
| | sky | 14.7 | 14.7 | 14.8
| | S/N | 18.0 | 28.5 | 31.8
| | S/N(c) | 16.1 | 26.6 | 30.0
| | SN(E/C) 0.79
|
| 
| 
| 
| 
| 
|
| 2860059
| 47
| | Red | Green | Blue
| | z | | 19.09
| | znorm | | 14.91
| | sky | 14.7 | 14.9 | 14.9
| | S/N | 17.8 | 28.1 | 30.7
| | S/N(c) | 15.7 | 26.4 | 29.3
| | SN(E/C) 0.84
|
| 
| 
| 
| 
| 
|
| 2860060
| 47
| | Red | Green | Blue
| | z | | 19.07
| | znorm | | 14.89
| | sky | 14.9 | 14.7 | 14.9
| | S/N | 17.9 | 28.0 | 30.8
| | S/N(c) | 15.6 | 26.3 | 29.1
| | SN(E/C) 0.89
|
| 
| 
| 
| 
| 
|