| Frame | Nreads | Zeropoints | Mag plots
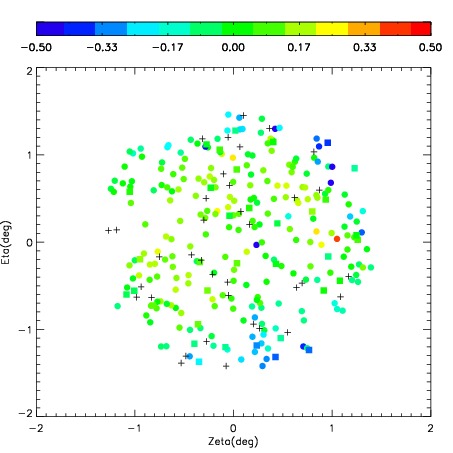
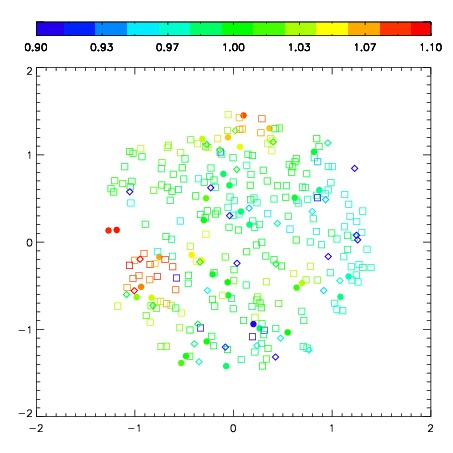
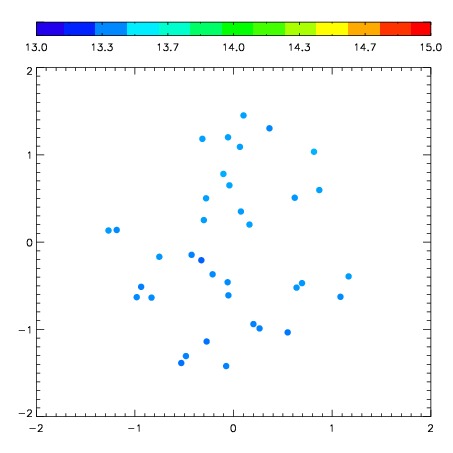
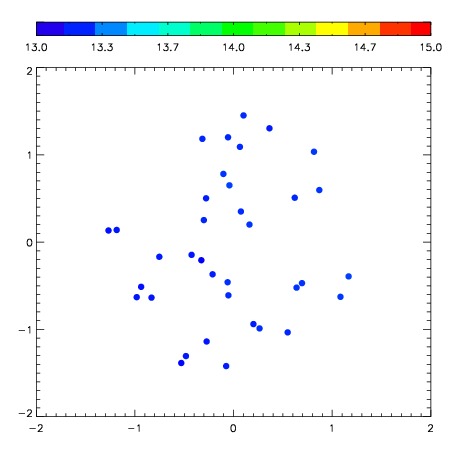
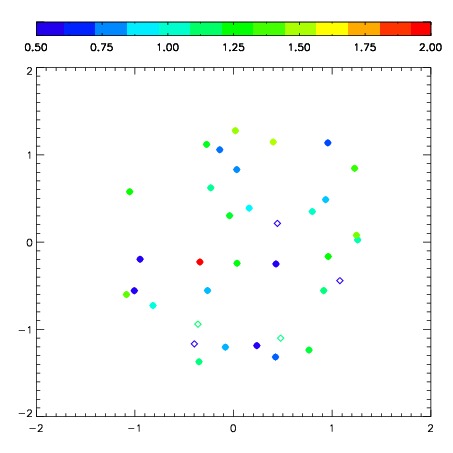
| Spatial mag deviation
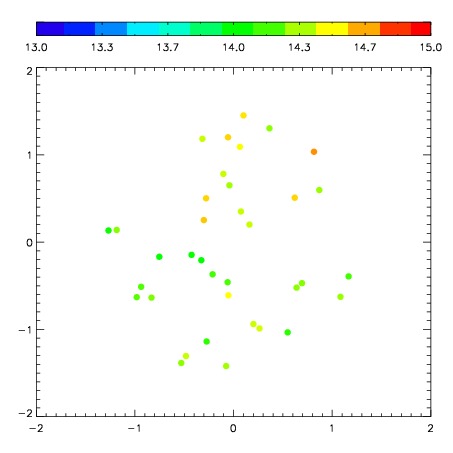
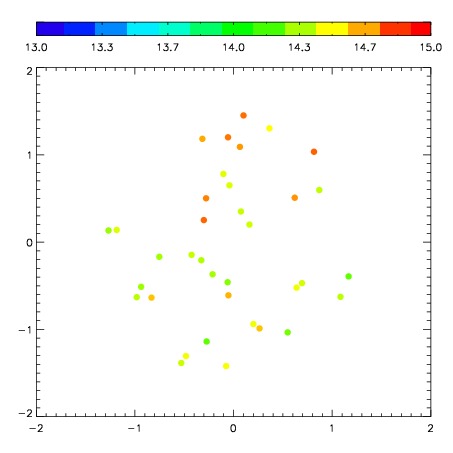
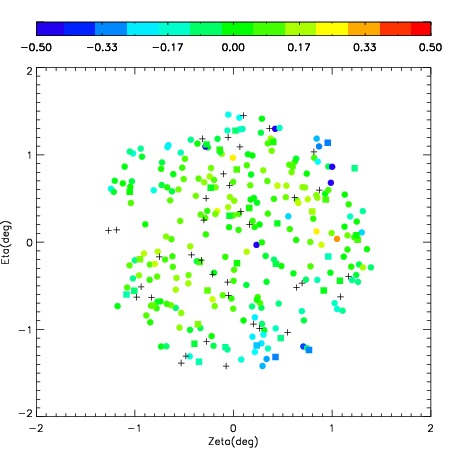
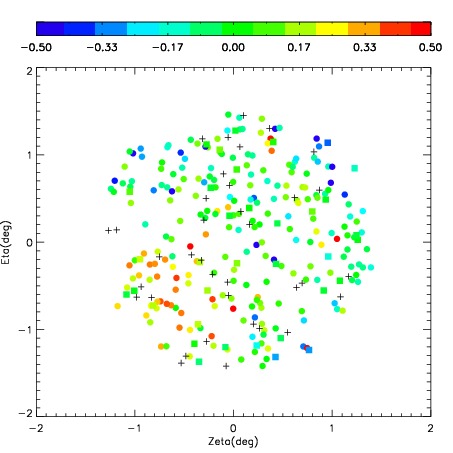
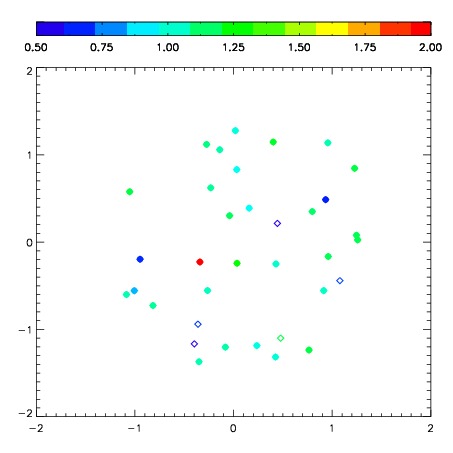
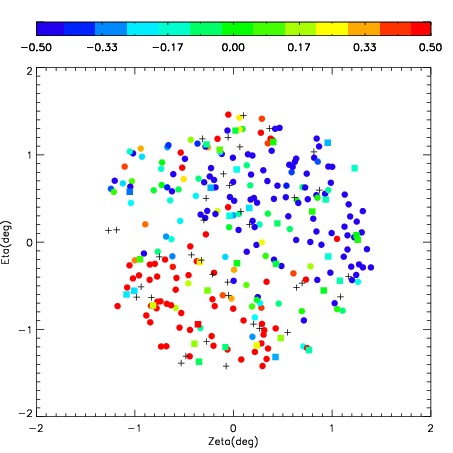
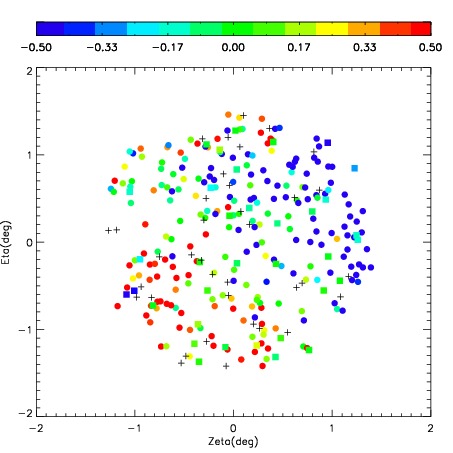
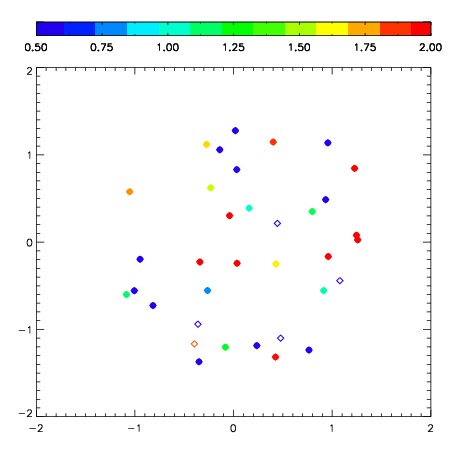
| Spatial sky 16325A emission deviations (filled: sky, open: star)
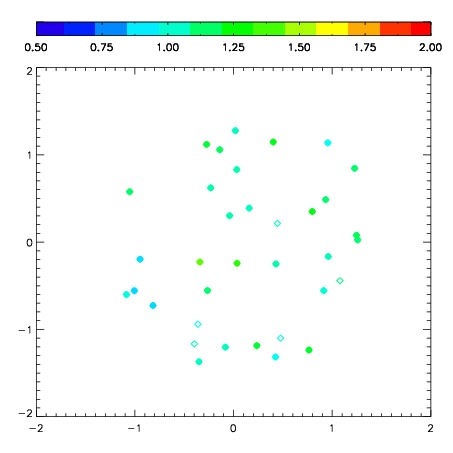
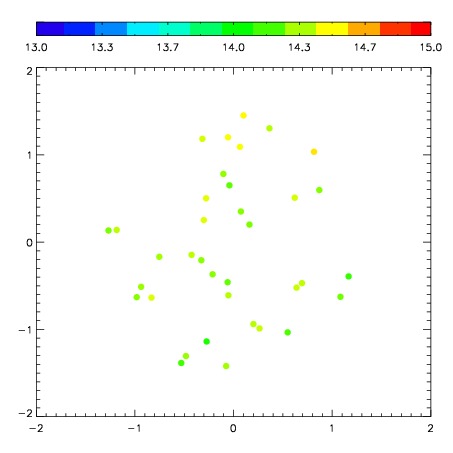
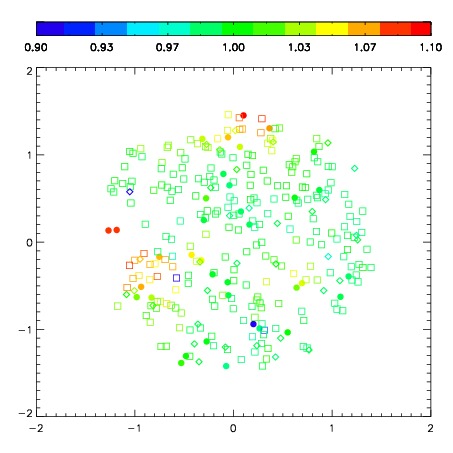
| Spatial sky continuum emission
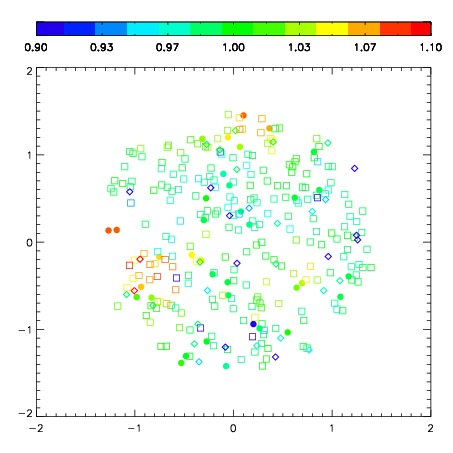
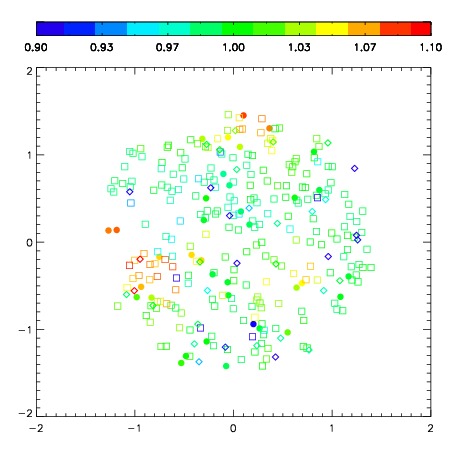
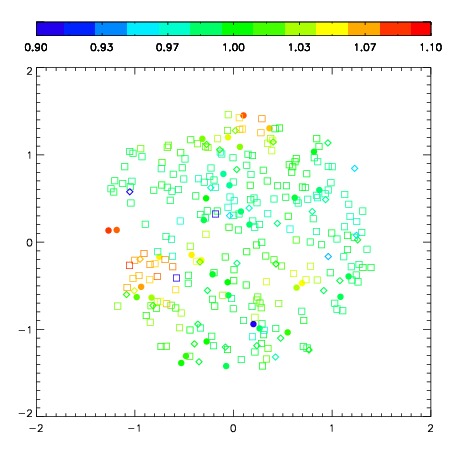
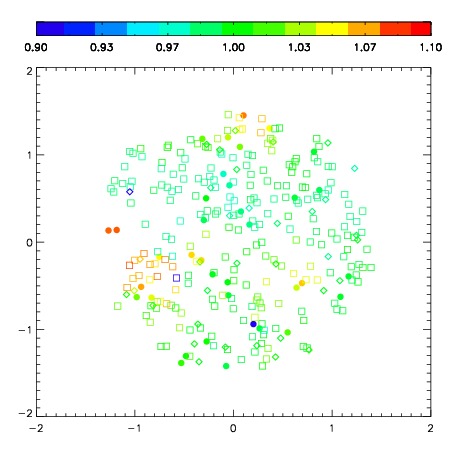
| Spatial sky telluric CO2 absorption deviations (filled: H < 10)
|
| 3100043
| 47
| | Red | Green | Blue
| | z | | 18.88
| | znorm | | 14.69
| | sky | 14.8 | 14.2 | 14.5
| | S/N | 13.1 | 21.8 | 25.4
| | S/N(c) | 11.3 | 20.4 | 23.7
| | SN(E/C) 0.86
|
| 
| 
| 
| 
| 
|
| 3100044
| 47
| | Red | Green | Blue
| | z | | 18.89
| | znorm | | 14.71
| | sky | 14.6 | 14.4 | 14.5
| | S/N | 13.4 | 21.9 | 25.8
| | S/N(c) | 11.6 | 20.1 | 24.3
| | SN(E/C) 0.90
|
| 
| 
| 
| 
| 
|
| 3100045
| 47
| | Red | Green | Blue
| | z | | 18.81
| | znorm | | 14.63
| | sky | 14.7 | 14.4 | 14.6
| | S/N | 12.7 | 20.7 | 23.7
| | S/N(c) | 11.1 | 19.2 | 22.3
| | SN(E/C) 0.89
|
| 
| 
| 
| 
| 
|
| 3100046
| 47
| | Red | Green | Blue
| | z | | 18.64
| | znorm | | 14.46
| | sky | 14.4 | 14.3 | 14.4
| | S/N | 11.2 | 19.0 | 21.9
| | S/N(c) | 9.6 | 17.2 | 20.3
| | SN(E/C) 0.90
|
| 
| 
| 
| 
| 
|
| 3100047
| 47
| | Red | Green | Blue
| | z | | 16.52
| | znorm | | 12.34
| | sky | 13.5 | 13.3 | 13.4
| | S/N | 1.6 | 3.7 | 4.2
| | S/N(c) | 1.4 | 3.3 | 3.7
| | SN(E/C) 0.99
|
| 
| 
| 
| 
| 
|
| 3100048
| 47
| | Red | Green | Blue
| | z | | 15.77
| | znorm | | 11.59
| | sky | 13.3 | 13.1 | 13.2
| | S/N | 0.6 | 2.0 | 2.4
| | S/N(c) | 0.9 | 1.9 | 1.8
| | SN(E/C) 1.00
|
| 
| 
| 
| 
| 
|
| 3100049
| 47
| | Red | Green | Blue
| | z | | 14.18
| | znorm | | 10.00
| | sky | 12.9 | 12.8 | 12.8
| | S/N | 0.2 | 0.5 | 0.6
| | S/N(c) | 0.0 | 0.0 | 0.0
| | SN(E/C) 1.85
|
| 
| 
| 
| 
| 
|
| 3100050
| 47
| | Red | Green | Blue
| | z | | 14.74
| | znorm | | 10.56
| | sky | 13.6 | 13.5 | 13.5
| | S/N | 0.3 | 1.0 | 1.0
| | S/N(c) | 0.2 | 1.0 | 0.9
| | SN(E/C) 1.13
|
| 
| 
| 
| 
| 
|