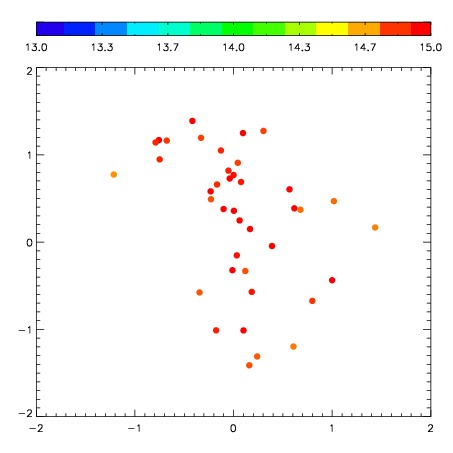
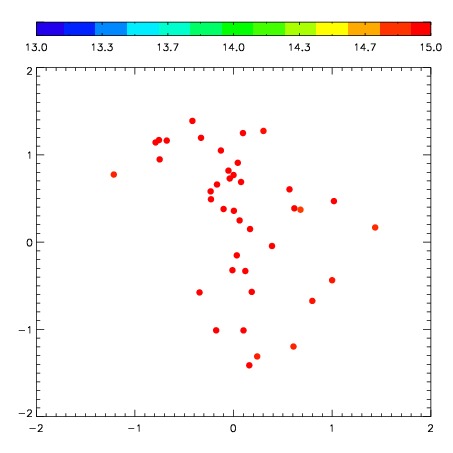
| Frame | Nreads | Zeropoints | Mag plots
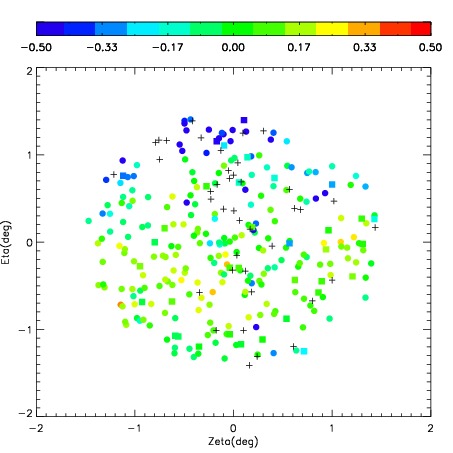
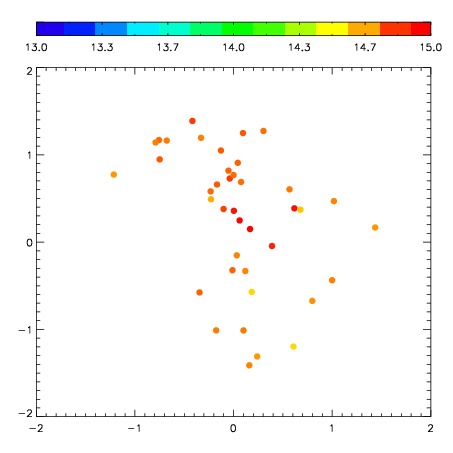
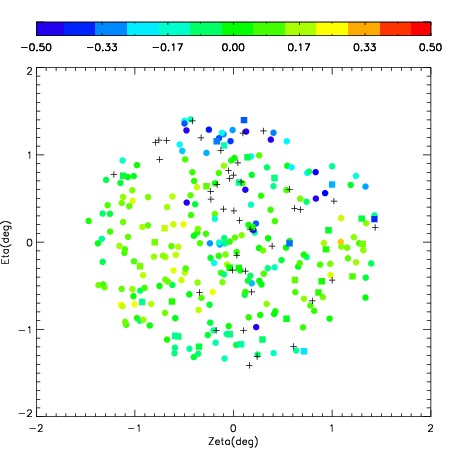
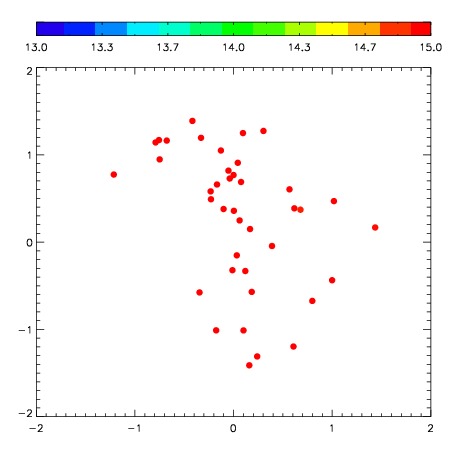
| Spatial mag deviation
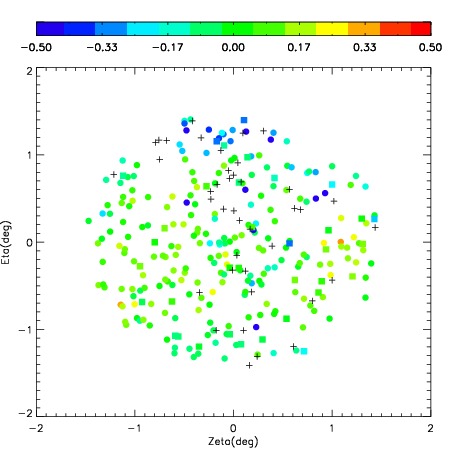
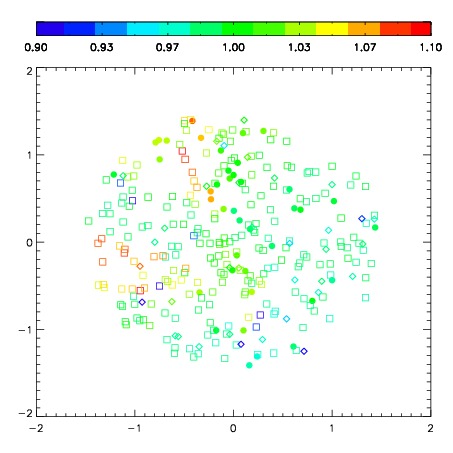
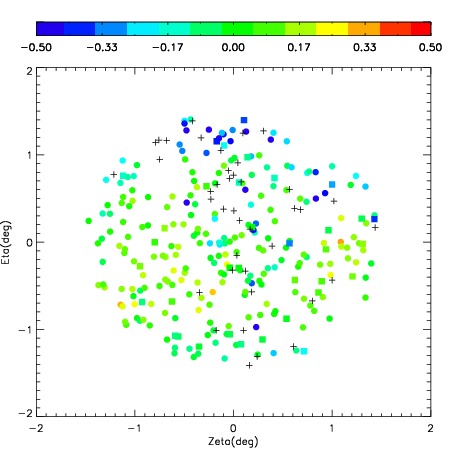
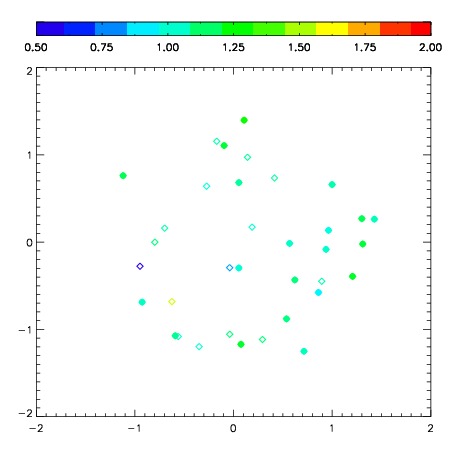
| Spatial sky 16325A emission deviations (filled: sky, open: star)
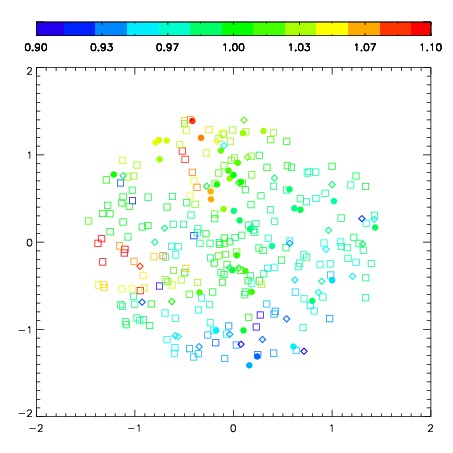
| Spatial sky continuum emission
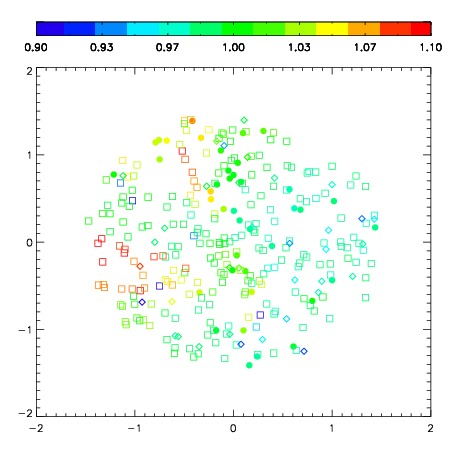
| Spatial sky telluric CO2 absorption deviations (filled: H < 10)
|
| 2810027
| 47
| | Red | Green | Blue
| | z | | 18.63
| | znorm | | 14.45
| | sky | 14.9 | 14.7 | 14.8
| | S/N | 11.4 | 18.2 | 23.3
| | S/N(c) | 9.7 | 16.4 | 21.7
| | SN(E/C) 0.92
|
| 
| 
| 
| 
| 
|
| 2810028
| 47
| | Red | Green | Blue
| | z | | 18.47
| | znorm | | 14.29
| | sky | 15.0 | 14.9 | 15.1
| | S/N | 10.6 | 16.9 | 21.7
| | S/N(c) | 9.3 | 15.1 | 20.1
| | SN(E/C) 0.89
|
| 
| 
| 
| 
| 
|
| 2810029
| 47
| | Red | Green | Blue
| | z | | 18.52
| | znorm | | 14.34
| | sky | 15.2 | 14.9 | 15.4
| | S/N | 11.0 | 17.7 | 22.7
| | S/N(c) | 9.7 | 16.0 | 21.1
| | SN(E/C) 0.90
|
| 
| 
| 
| 
| 
|
| 2810030
| 47
| | Red | Green | Blue
| | z | | 18.51
| | znorm | | 14.33
| | sky | 15.2 | 14.8 | 15.4
| | S/N | 10.8 | 17.1 | 21.8
| | S/N(c) | 9.3 | 15.4 | 20.4
| | SN(E/C) 0.90
|
| 
| 
| 
| 
| 
|
| 2810031
| 47
| | Red | Green | Blue
| | z | | 18.57
| | znorm | | 14.39
| | sky | 14.9 | 15.0 | 15.4
| | S/N | 11.1 | 18.0 | 22.6
| | S/N(c) | 9.7 | 16.2 | 21.0
| | SN(E/C) 0.91
|
| 
| 
| 
| 
| 
|
| 2810032
| 47
| | Red | Green | Blue
| | z | | 18.67
| | znorm | | 14.49
| | sky | 15.0 | 15.0 | 15.2
| | S/N | 11.2 | 18.8 | 23.1
| | S/N(c) | 10.1 | 16.9 | 21.7
| | SN(E/C) 0.95
|
| 
| 
| 
| 
| 
|
| 2810033
| 47
| | Red | Green | Blue
| | z | | 18.62
| | znorm | | 14.44
| | sky | 15.3 | 15.1 | 15.1
| | S/N | 11.1 | 18.4 | 22.8
| | S/N(c) | 9.9 | 16.6 | 21.4
| | SN(E/C) 0.92
|
| 
| 
| 
| 
| 
|
| 2810034
| 47
| | Red | Green | Blue
| | z | | 18.50
| | znorm | | 14.32
| | sky | 14.9 | 14.9 | 15.2
| | S/N | 10.0 | 17.2 | 21.3
| | S/N(c) | 8.9 | 15.4 | 20.0
| | SN(E/C) 0.94
|
| 
| 
| 
| 
| 
|