| Red | Green | Blue | |
| z | 17.64 | ||
| znorm | Inf | ||
| sky | -Inf | -Inf | -Inf |
| S/N | 22.7 | 40.6 | 44.7 |
| S/N(c) | 0.0 | 0.0 | 0.0 |
| SN(E/C) |
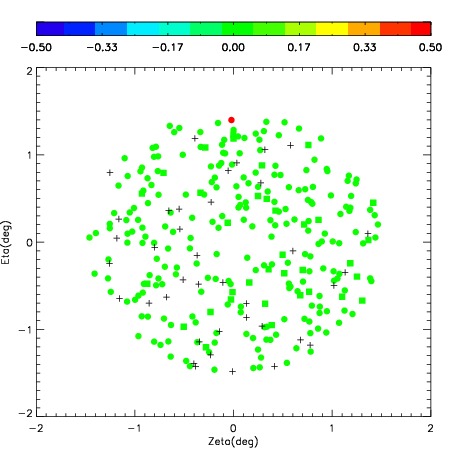
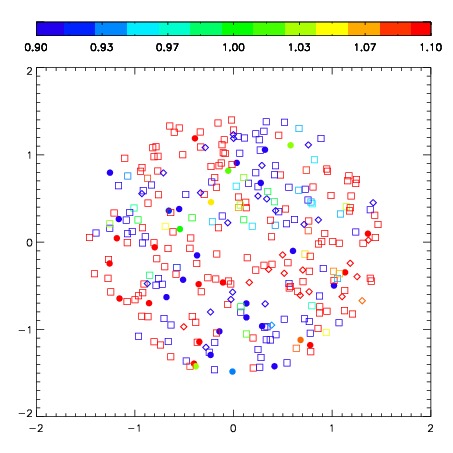


| Frame | Nreads | Zeropoints | Mag plots | Spatial mag deviation | Spatial sky 16325A emission deviations (filled: sky, open: star) | Spatial sky continuum emission | Spatial sky telluric CO2 absorption deviations (filled: H < 10) | |||||||||||||||||||||||
| 0 | 0 |
|
|
|
|
|
|
| IPAIR | NAME | SHIFT | NEWSHIFT | S/N | NAME | SHIFT | NEWSHIFT | S/N |
| 0 | 03680036 | 0.473238 | 0.00000 | 189.640 | 03680037 | 0.00467142 | 0.468567 | 164.005 |
| 1 | 03680035 | 0.470651 | 0.00258699 | 247.527 | 03680041 | 0.0128124 | 0.460426 | 246.156 |
| 2 | 03680040 | 0.466818 | 0.00641999 | 245.401 | 03680034 | 0.00000 | 0.473238 | 229.262 |
| 3 | 03680039 | 0.468494 | 0.00474399 | 239.678 | 03680038 | 0.00662331 | 0.466615 | 225.172 |