| Red | Green | Blue | |
| z | 17.64 | ||
| znorm | Inf | ||
| sky | -Inf | -Inf | -Inf |
| S/N | 21.9 | 38.1 | 43.8 |
| S/N(c) | 0.0 | 0.0 | 0.0 |
| SN(E/C) |
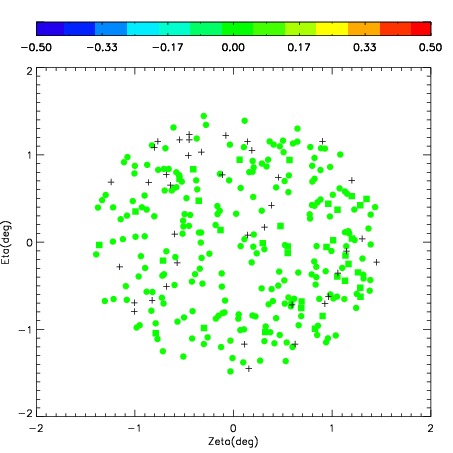
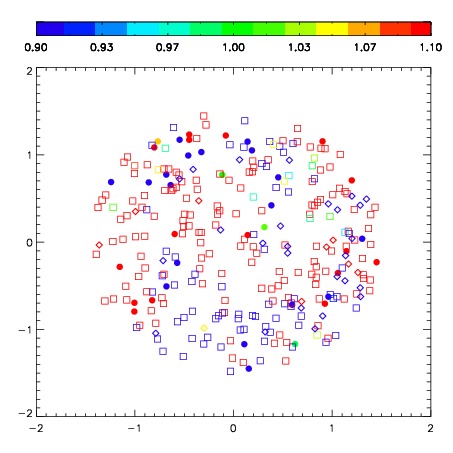

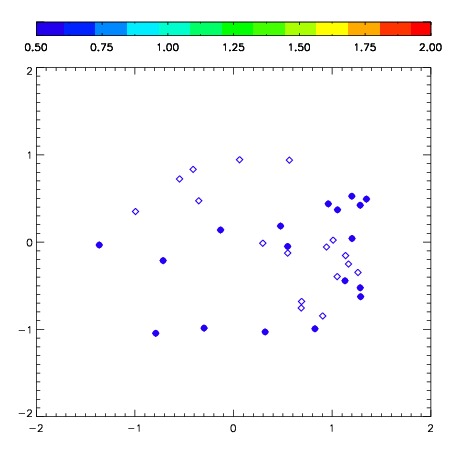
| Frame | Nreads | Zeropoints | Mag plots | Spatial mag deviation | Spatial sky 16325A emission deviations (filled: sky, open: star) | Spatial sky continuum emission | Spatial sky telluric CO2 absorption deviations (filled: H < 10) | |||||||||||||||||||||||
| 0 | 0 |
|
|
|
|
|
|
| IPAIR | NAME | SHIFT | NEWSHIFT | S/N | NAME | SHIFT | NEWSHIFT | S/N |
| 0 | 03420048 | 0.495693 | 0.00000 | 171.558 | 03420047 | 0.00000 | 0.495693 | 177.111 |
| 1 | 03420053 | 0.491566 | 0.00412700 | 202.455 | 03420054 | 0.0284530 | 0.467240 | 223.485 |
| 2 | 03420049 | 0.488322 | 0.00737101 | 201.032 | 03420050 | 0.0269875 | 0.468706 | 202.247 |
| 3 | 03420052 | 0.494216 | 0.00147700 | 197.279 | 03420051 | 0.0295414 | 0.466152 | 195.918 |